Friday, July 07, 2006
The Week Ahead...
The Phillies loss to the Padres last night runs their record since June 8 to six wins and nineteen losses. C’est la vie.
Jon Lieber starts tonight for the Phillies against the Pirates. I expect Lieber to have some rust, so I am just hoping for a solid five innings out of him tonight. Bottom-line though is that the Phillies really, really need to win this series and start to make a little ground. The Phillies are presently six games out of the wildcard. There are seven teams ahead of them. Now is the time to start winning.
I see that the Eagles training camp starts on July 20. This time of year I am sorely tempted to bring back The Bird Blog, my old Eagles blog that I ran off-and-on back in ’04 and ’05. Sure, they are coming off a 6-10 campaign, have some holes (why doesn’t this team add a running back or two?), and need to clean up from the T.O. mess, but you feel like the Eagles organization has the intelligence and skill to make things happen. You look at Andy Reid, Joe Banner and Donovan McNabb and you have to think: “These are pretty savvy guys, they’ll get the job done.” You don’t feel that with the Phillies, do you?
What to look forward to? The All-Star game is being played five miles from my house (I live in the South Hills of Pittsburgh), but I am curiously uninterested in it. I have no clue why. Tuesday I am planning on my annual State of the Phillies Address. (Click here to read 2005's version.) I am also working on a post about the Phillies bullpen.
Have a nice weekend.
(2) comments
Jon Lieber starts tonight for the Phillies against the Pirates. I expect Lieber to have some rust, so I am just hoping for a solid five innings out of him tonight. Bottom-line though is that the Phillies really, really need to win this series and start to make a little ground. The Phillies are presently six games out of the wildcard. There are seven teams ahead of them. Now is the time to start winning.
I see that the Eagles training camp starts on July 20. This time of year I am sorely tempted to bring back The Bird Blog, my old Eagles blog that I ran off-and-on back in ’04 and ’05. Sure, they are coming off a 6-10 campaign, have some holes (why doesn’t this team add a running back or two?), and need to clean up from the T.O. mess, but you feel like the Eagles organization has the intelligence and skill to make things happen. You look at Andy Reid, Joe Banner and Donovan McNabb and you have to think: “These are pretty savvy guys, they’ll get the job done.” You don’t feel that with the Phillies, do you?
What to look forward to? The All-Star game is being played five miles from my house (I live in the South Hills of Pittsburgh), but I am curiously uninterested in it. I have no clue why. Tuesday I am planning on my annual State of the Phillies Address. (Click here to read 2005's version.) I am also working on a post about the Phillies bullpen.
Have a nice weekend.
Thursday, July 06, 2006
Addendum...
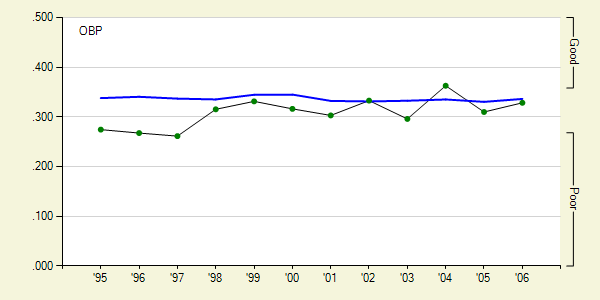
In the post below, I neglect to note that the graphs are of David Bell's OBP and ISO.
(0) comments
Bell or Nunez?
I often feel bad for David Bell. He seems like a nice enough guy, yet he is frequently the whipping boy of fans and pundits and bloggers, though I have often defended him on the grounds that he is a very good fielder at third base. Bell has once more resumed his struggles at the plate. In the month of June Bell had a GPA of .205 and slugged a paltry .240 … His raw power at the plate was about as bad as it got: .027 … it fact, his sole extra-base hits in the month were a pair of doubles he hit on June 1 against the Dodgers. Throw those two hits out and Bell hit fifteen singles in June. Little surprise his slugging percentage fell from .416 to .349 …
From top to bottom, David Bell is having a miserable campaign. He’s hitting .228 with runners in scoring position. He’s hitting a home run once every 59.3 At-Bat’s, compared with 20.7 for Chase Utley, 31.9 for Bobby Abreu, 12.5 for Pat Burrell and 10.8 for Ryan Howard. His isolated power (ISO) is a paltry .101, behind even Sal Fasano (.149). Things really could not get much worse, but many are calling for Bell to sit in favor of Abraham Nunez, or at least platoon the two and play Bell only against left-handed pitchers. Which gets me to the working title of this post:
David Bell: The Lesser of Two Evils (Which is the nicest thing I could say…)
Yes, David Bell is the lesser of two evils. Abraham Nunez is a terrible hitter who would be a massive drain on the Phillies lineup … check that, a total drain on the Phillies lineup. Let me explain why …
Okay, David Bell has accumulated about 28 Runs Created thus far in 2006. Confused about the gibberish I am speaking? Hold on. Runs Created is a stat originally created by Bill James to measure a player’s total contribution to his team’s lineup. Here is the formula ESPN (where I get it from) uses: [(H + BB + HBP - CS - GIDP) times (Total bases + .26[BB - IBB + HBP] + .52[SH + SF + SB])] divided by (AB + BB + HBP + SH+ SF). ESPN’s version is out-of-date, however, I’d note. James adjusted RC after the 2004 season ended, but I haven’t the time or energy to do my own numbers. Other stats you should know: GPA (Gross Productive Average): (1.8 * .OBP + .SLG) / 4 = .GPA. Invented by The Hardball Times Aaron Gleeman, GPA measures a players production by weighing his ability to get on base and hit with power. This is my preferred all-around stat. RC/27: Runs Created per 27 outs, essentially what a team of 9 of this player would score in a hypothetical game. ISO (Isolated Power): .SLG - .BA = .ISO. Measures a player’s raw power by subtracting singles from their slugging percentage. OBP (On-Base Percentage): How often a player gets on base. (H + BB + HBP) / (Plate Appearances) BB / PA (Walks per plate appearance): (BB / PA = .BB/PA Avg) SLG (Slugging Percentage): Power at the plate. (Total Bases / At-Bats = Slugging Percentage)
Okay, with me? Alright, David Bell has 28 Runs Created. He has 3.92 Runs Created per 27 outs. Abraham Nunez? 1 Run Created in 94 At-Bats. 0.34 Runs Created per 27 outs. Yes, a team of nine Abraham Nunez’s would accumulate one run every three games, or 52 over the course of a season. Whatever his faults, a team of David Bells would score 635 runs in a season.
Simply put, Nunez is a terrible hitter. Thus far in 2006, he is drawing .041 walks per plate appearance, has hit one home run in 94 At-Bats, has an isolated power of .064. His GPA is a whopping .136 … .136 … I find it difficult to believe that any player could play that badly. You have to try to be that bad.
Mind you, this isn’t a recent phenomenon. Nunez’s career slugging percentage is .326, eighty points lower than Bell’s (.396). In his career, Abraham Nunez has 104 extra-base hits, and it took him 2,006 At-Bats to get there. Entering the 2006 season, Nunez’s ISO was .078 … Whatever Bell’s faults, his ISO is a respectable .141. So Bell has a more explosive bat … Both are equally bad at getting on base (Nunez: .314 career OBP, Bell: .318), but Nunez has nothing to compensate for his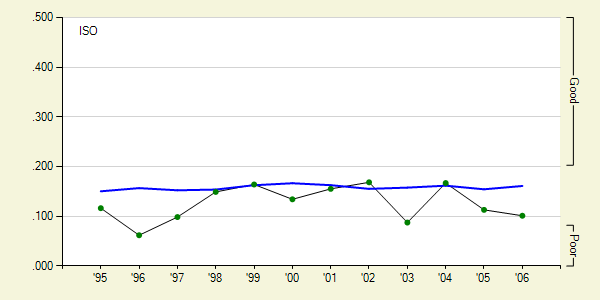 weak-hitting.
Now interestingly enough, Bell hits left-handed pitching like gangbusters. Check out his left/right splits from 2005:
vs. right: .189 GPA / .061
vs. left: .356 GPA / .193
However, Nunez performance is so lousy that even platooning the two makes little sense. Bell can’t hit righties, but Nunez can’t hit anyone.
In terms of fielding, the water gets a bit muddier. Bell and Nunez are both actually quite good. I’ve been over this time and again with Bell, so I am wary of repeating myself, but Bell is one of the best defensive third basemen in the game. If there were a designated fielder, then Bell would be set. In fact, when his contract is up this fall, I hope Bell tries to stay in the league as a backup or as a defensive substitute because he’s got talent. In 2005 he led the MLB in Plus / Minus, the fielding system developed by John Dewan in The Fielding Bible with +24 plays. Bell also had a terrific relative range factor, an update of Bill James classic range factor stat re-designed by James to make it pitcher-neutral. Range Factor: (Putouts + Assists) * 9 / IP. Essentially measures how much a player is involved in defensive plays.
Bell’s relative range factor (RRF) was 1.079 (1.000 being average). The Fielding Bible said of Bell: “He has very good range with good hands and footwork … he has a quick release and good accuracy with his throws.” (Page 162.)
Nunez switched to third from second in 2005 and played well. He was tenth in the MLB in Plus / Minus at +9 and his RRF was 1.055, which is pretty good. But, again, Bell is clearly superior to Nunez here. His +24 in 2005 was roughly the same as his 2004, when he was +22 and finished third in the majors in Plus / Minus. Bell has finished with a 1.065 RRF or better for the last three years. He’s a talented player in the field. Nunez has talent, but he can’t equal it.
So there you go, a long, cogent argument about why David Bell is the lesser of two evils. I promise I won’t write about David Bell again until the end of the season. Or until another topic comes up.
(1) comments
From top to bottom, David Bell is having a miserable campaign. He’s hitting .228 with runners in scoring position. He’s hitting a home run once every 59.3 At-Bat’s, compared with 20.7 for Chase Utley, 31.9 for Bobby Abreu, 12.5 for Pat Burrell and 10.8 for Ryan Howard. His isolated power (ISO) is a paltry .101, behind even Sal Fasano (.149). Things really could not get much worse, but many are calling for Bell to sit in favor of Abraham Nunez, or at least platoon the two and play Bell only against left-handed pitchers. Which gets me to the working title of this post:
David Bell: The Lesser of Two Evils (Which is the nicest thing I could say…)
Yes, David Bell is the lesser of two evils. Abraham Nunez is a terrible hitter who would be a massive drain on the Phillies lineup … check that, a total drain on the Phillies lineup. Let me explain why …
Okay, David Bell has accumulated about 28 Runs Created thus far in 2006. Confused about the gibberish I am speaking? Hold on. Runs Created is a stat originally created by Bill James to measure a player’s total contribution to his team’s lineup. Here is the formula ESPN (where I get it from) uses: [(H + BB + HBP - CS - GIDP) times (Total bases + .26[BB - IBB + HBP] + .52[SH + SF + SB])] divided by (AB + BB + HBP + SH+ SF). ESPN’s version is out-of-date, however, I’d note. James adjusted RC after the 2004 season ended, but I haven’t the time or energy to do my own numbers. Other stats you should know: GPA (Gross Productive Average): (1.8 * .OBP + .SLG) / 4 = .GPA. Invented by The Hardball Times Aaron Gleeman, GPA measures a players production by weighing his ability to get on base and hit with power. This is my preferred all-around stat. RC/27: Runs Created per 27 outs, essentially what a team of 9 of this player would score in a hypothetical game. ISO (Isolated Power): .SLG - .BA = .ISO. Measures a player’s raw power by subtracting singles from their slugging percentage. OBP (On-Base Percentage): How often a player gets on base. (H + BB + HBP) / (Plate Appearances) BB / PA (Walks per plate appearance): (BB / PA = .BB/PA Avg) SLG (Slugging Percentage): Power at the plate. (Total Bases / At-Bats = Slugging Percentage)

Okay, with me? Alright, David Bell has 28 Runs Created. He has 3.92 Runs Created per 27 outs. Abraham Nunez? 1 Run Created in 94 At-Bats. 0.34 Runs Created per 27 outs. Yes, a team of nine Abraham Nunez’s would accumulate one run every three games, or 52 over the course of a season. Whatever his faults, a team of David Bells would score 635 runs in a season.
Simply put, Nunez is a terrible hitter. Thus far in 2006, he is drawing .041 walks per plate appearance, has hit one home run in 94 At-Bats, has an isolated power of .064. His GPA is a whopping .136 … .136 … I find it difficult to believe that any player could play that badly. You have to try to be that bad.
Mind you, this isn’t a recent phenomenon. Nunez’s career slugging percentage is .326, eighty points lower than Bell’s (.396). In his career, Abraham Nunez has 104 extra-base hits, and it took him 2,006 At-Bats to get there. Entering the 2006 season, Nunez’s ISO was .078 … Whatever Bell’s faults, his ISO is a respectable .141. So Bell has a more explosive bat … Both are equally bad at getting on base (Nunez: .314 career OBP, Bell: .318), but Nunez has nothing to compensate for his
 weak-hitting.
Now interestingly enough, Bell hits left-handed pitching like gangbusters. Check out his left/right splits from 2005:
vs. right: .189 GPA / .061
vs. left: .356 GPA / .193
However, Nunez performance is so lousy that even platooning the two makes little sense. Bell can’t hit righties, but Nunez can’t hit anyone.
In terms of fielding, the water gets a bit muddier. Bell and Nunez are both actually quite good. I’ve been over this time and again with Bell, so I am wary of repeating myself, but Bell is one of the best defensive third basemen in the game. If there were a designated fielder, then Bell would be set. In fact, when his contract is up this fall, I hope Bell tries to stay in the league as a backup or as a defensive substitute because he’s got talent. In 2005 he led the MLB in Plus / Minus, the fielding system developed by John Dewan in The Fielding Bible with +24 plays. Bell also had a terrific relative range factor, an update of Bill James classic range factor stat re-designed by James to make it pitcher-neutral. Range Factor: (Putouts + Assists) * 9 / IP. Essentially measures how much a player is involved in defensive plays.
Bell’s relative range factor (RRF) was 1.079 (1.000 being average). The Fielding Bible said of Bell: “He has very good range with good hands and footwork … he has a quick release and good accuracy with his throws.” (Page 162.)
Nunez switched to third from second in 2005 and played well. He was tenth in the MLB in Plus / Minus at +9 and his RRF was 1.055, which is pretty good. But, again, Bell is clearly superior to Nunez here. His +24 in 2005 was roughly the same as his 2004, when he was +22 and finished third in the majors in Plus / Minus. Bell has finished with a 1.065 RRF or better for the last three years. He’s a talented player in the field. Nunez has talent, but he can’t equal it.
So there you go, a long, cogent argument about why David Bell is the lesser of two evils. I promise I won’t write about David Bell again until the end of the season. Or until another topic comes up.
Wednesday, July 05, 2006
Waiting for Jon Lieber...
When the Phillies signed former Cub and Yankee free agent Jon Lieber to a three-year deal following the 2004 campaign I was certain that the Phils had gotten a bargain. Lieber was a groundball pitcher who was absurdly accurate on the mound: second in the AL in pitches in the strike-zone in 2004 (59.8% to Curt Schilling’s 61.9%). Lieber allowed just 1.02 Home Runs per nine innings pitched and 0.91 walks per nine innings with the Yankees in 2004. If he could duplicate, or come close to equaling that for the Phillies, he’d be worth every penny, I felt. Lieber was always, consistently, a pitcher who did well keeping runners off the base paths. 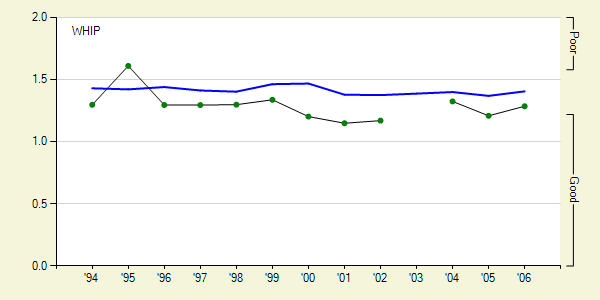 (See, his career WHIP totals, courtesy of Fangraphs.com)
I was rather disappointed by Lieber’s 2004 campaign, but I noted that once Lieber settled in and began to get comfortable, he turned into a new pitcher after the All-Star break, one who kept cheap base-runners off the base-paths and who allowed few home runs.
This season I was once more disappointed, though not by Lieber’s performance. Lieber began the season surrendering just five home runs in fifty-two and a third innings (0.86 per 9 innings), before getting shelled with six home runs in thirteen innings prior to going on the 15-Day DL on May 30. Even after giving up four walks to the Mets on May 24, Lieber still was allowing 1.24 per nine innings (the Mets game nearly doubled the number of walks allowed by Lieber from five to nine).
Confused about what I’m talking about? Here are the stats I refer to defined:
WHIP – Walks plus hits by innings pitched: (BB + H) / IP = WHIP
ERA – Earned Run Average: (Earned Runs * 9) / IP = ERA
FIP – Fielding Independent Pitching: (13*HR+3*BB-2*K / IP) + League Factor Evaluates a pitching by how he would have done with an average defense behind him by keeping track of things that a pitcher can control (walks, strikeouts, home runs allowed) as opposed to things he cannot (hits allowed, runs allowed).
HR/9 – Home Runs allowed per nine innings: (HR * 9) / IP
K/9 – Strikeouts per nine innings: (K * 9) / IP
BB/9 – Walks per nine innings: (BB * 9) / IP
I couldn’t help but think that the team could have really used Lieber in the month of June and that his absence was a major reason why the team pitching collapsed in the month. Here is a quick overview of how the Phillies pitching went south in June:
April / May / June
HR / 9: 1.09 / 1.27 / 1.28
BB / 9: 3.33 / 3.18 / 3.84
K / 9: 6.89 / 7.03 / 6.08
Now here are Lieber’s numbers:
HR / 9: 1.52
BB / 9: 1.24
K / 9: 5.79
Okay, keep in mind the fact that six of the eleven home runs Lieber surrendered in 2006 were in a three-game / thirteen-inning time-frame, and that four of the nine walks were in a single game. I think that once Lieber returns from the DL he is going to have a tremendous impact because he is going to turn in a terrific performance doing what he does best: keeping guys off the base-paths, keeping the ball in the park and letting the Phillies fielders make plays. Which brings me to another point: Lieber isn’t a strikeout artist. He lets batters put the ball into play with weak pop-flies off of his sliders and allows the Phillies fielders to make the outs. The Phillies struggles defensively are making Lieber look weaker than he really is: Lieber’s FIP ERA is 4.58, 1.21 lower than his “real” ERA of 5.79. Okay, 4.58 isn’t great, but most of that was inflated by the Mets game and the Red Sox game where he gave up three home runs.
Get well soon, Jon. This team needs you!
(1) comments
 (See, his career WHIP totals, courtesy of Fangraphs.com)
I was rather disappointed by Lieber’s 2004 campaign, but I noted that once Lieber settled in and began to get comfortable, he turned into a new pitcher after the All-Star break, one who kept cheap base-runners off the base-paths and who allowed few home runs.
This season I was once more disappointed, though not by Lieber’s performance. Lieber began the season surrendering just five home runs in fifty-two and a third innings (0.86 per 9 innings), before getting shelled with six home runs in thirteen innings prior to going on the 15-Day DL on May 30. Even after giving up four walks to the Mets on May 24, Lieber still was allowing 1.24 per nine innings (the Mets game nearly doubled the number of walks allowed by Lieber from five to nine).
Confused about what I’m talking about? Here are the stats I refer to defined:
WHIP – Walks plus hits by innings pitched: (BB + H) / IP = WHIP
ERA – Earned Run Average: (Earned Runs * 9) / IP = ERA
FIP – Fielding Independent Pitching: (13*HR+3*BB-2*K / IP) + League Factor Evaluates a pitching by how he would have done with an average defense behind him by keeping track of things that a pitcher can control (walks, strikeouts, home runs allowed) as opposed to things he cannot (hits allowed, runs allowed).
HR/9 – Home Runs allowed per nine innings: (HR * 9) / IP
K/9 – Strikeouts per nine innings: (K * 9) / IP
BB/9 – Walks per nine innings: (BB * 9) / IP
I couldn’t help but think that the team could have really used Lieber in the month of June and that his absence was a major reason why the team pitching collapsed in the month. Here is a quick overview of how the Phillies pitching went south in June:
April / May / June
HR / 9: 1.09 / 1.27 / 1.28
BB / 9: 3.33 / 3.18 / 3.84
K / 9: 6.89 / 7.03 / 6.08
Now here are Lieber’s numbers:
HR / 9: 1.52
BB / 9: 1.24
K / 9: 5.79
Okay, keep in mind the fact that six of the eleven home runs Lieber surrendered in 2006 were in a three-game / thirteen-inning time-frame, and that four of the nine walks were in a single game. I think that once Lieber returns from the DL he is going to have a tremendous impact because he is going to turn in a terrific performance doing what he does best: keeping guys off the base-paths, keeping the ball in the park and letting the Phillies fielders make plays. Which brings me to another point: Lieber isn’t a strikeout artist. He lets batters put the ball into play with weak pop-flies off of his sliders and allows the Phillies fielders to make the outs. The Phillies struggles defensively are making Lieber look weaker than he really is: Lieber’s FIP ERA is 4.58, 1.21 lower than his “real” ERA of 5.79. Okay, 4.58 isn’t great, but most of that was inflated by the Mets game and the Red Sox game where he gave up three home runs.
Get well soon, Jon. This team needs you!
Monday, July 03, 2006
Good-bye, June...
June is over and not a moment too soon for this team, which went 9-17 in the month, saw their best pitcher (allegedly) assail his wife and then mishandled the incident, and then dropped pretty out completely out of the NL East pennant race. Now a new month dawns and the Phillies desperately need to make up some ground and get back into the thick of things. I have a few notes today.
1) Friday’s The Hardball Times article Phlop I think nicely sums up the Phillies woes, but I think it is a little incomplete. Yes, the Phillies pitching went AWOL in June, but notice a big factor in the collapse of the Phillies pitching:
Anyone notice or comment on the fact that Jon Lieber hasn’t pitched for the team in a month and that his departure for injury reasons coincided with the team’s horrific pitching performance? Admittedly, Lieber’s stats weren’t great when he left 4.57 FIP ERA, but I felt that Lieber was a badly under-rated pitcher and that he was about to improve his performance significantly.
2) Pitching problems aside, I noticed that John Brattain didn’t note that the Phillies have played terrible defense thus far this season. I keep waiting for the Phillies to improve on defense, but their .671 DER is second-worst in the NL, just better than Pittsburgh (.662).
3) The Phillies offense has been pretty much the same as it has been all season: the Phils have been scoring runs, but they haven’t hit well with runners in scoring position. Two Phillies have had rough months in June, however …
Aaron Rowand has had a terrible month, with a .202 GPA and a .110 ISO. I’ve complained that Rowand is too much of a free-swinger and that his inability to draw walks with any consistency leaves him prone to hot-and-cold streaks at the plate. Here is a great example of that: in the month of June, Rowand had the lowest pitches-per-plate appearance of any Phillie.
And Rowand had the worst runs created per 27 outs of any Phillie (2.37). Worse even than David Bell (2.60).
Speaking of whom … David Bell hasn’t been that much better. His GPA is an atrocious .205, and his ISO is a laughable .027 … In 95 plate appearances he mustered three extra-base hits and none were home runs.
Aside from Bell and Rowand, the Phillies continued to hit in June. Sure, Pat Burrell only had a batting average of .194, but his ISO for the month was a tremendous .306 and his OBP was .326 … Burrell’s ability to draw walks (.163 BB/PA) saved him even while he struggled a little at the plate. Burrell is still getting the job done.
Confused about what I’m talking about? Here are the stats I refer to defined:
ISO (Isolated Power): .SLG - .BA = .ISO. Measures a player’s raw power by subtracting singles from their slugging percentage.
OBP (On-Base Percentage): How often a player gets on base. (H + BB + HBP) / (Plate Appearances)
BB / PA (Walks per plate appearance): (BB / PA = .BB/PA Avg)
SLG (Slugging Percentage): Power at the plate. (Total Bases / At-Bats = Slugging Percentage)
GPA (Gross Productive Average): (1.8 * .OBP + .SLG) / 4 = .GPA. Invented by The Hardball Times Aaron Gleeman, GPA measures a players production by weighing his ability to get on base and hit with power. This is my preferred all-around stat.
Runs Created: A stat originally created by Bill James to measure a player’s total contribution to his team’s lineup. Here is the formula ESPN (where I get it from) uses: [(H + BB + HBP - CS - GIDP) times (Total bases + .26[BB - IBB + HBP] + .52[SH + SF + SB])] divided by (AB + BB + HBP + SH+ SF). ESPN’s version is out-of-date, however, I’d note. James adjusted RC after the 2004 season ended.
RC/27: Runs Created per 27 outs, essentially what a team of 9 of this player would score in a hypothetical game.
FIP – Fielding Independent Pitching: (13*HR+3*BB-2*K / IP) + League Factor Evaluates a pitching by how he would have done with an average defense behind him by keeping track of things that a pitcher can control (walks, strikeouts, home runs allowed) as opposed to things he cannot (hits allowed, runs allowed).
DER – Defense Efficiency Ratio: (Batters Faced – (Hits + Walks + Hit By Pitch + Strikeouts)) / (Batters Faced – (Home Runs, Walks + Hit By Pitch + Strikeouts)) How often fielders convert balls put into play into outs.
4) I figured that Chase Utley and Ryan Howard would represent the Phillies in the NL All Star game. I was rather surprised to see Tom Gordon make the cut. Good for him! Notice who isn’t closing for the NL? Billy Wagner. I’m mildly surprised that Bobby Abreu won’t be at the All Star game … Seriously, Matt Holliday over Abreu? I don’t see it.
5) Is the season really lost for the Phillies? I doubt it. I’ve said that the Phillies will probably need to win ninety games to make the playoffs. At the mid-point, that means that the Phillies will have to go 53-28 (.654) the rest of the season to make that happen. I concede that this is asking a lot, but I might be wrong. As of this morning the Cincinnati Reds were leading the NL wildcard race with a 44-38 (.537) record. If you extrapolate that over a 162 game season, then the Reds will finish with 87 wins. So my estimate of how many games the Phillies need to win might be way off. As of right now, even with their horrific record in their last twenty-two games (5-17), the Phillies are just six and a half games out of a playoff berth.
The Phillies have played badly, but they’ll have to play much worse to play themselves out of the playoffs.
That is NOT a challenge! More Wednesday. Tomorrow I am busy grilling and chillin’.
(1) comments
1) Friday’s The Hardball Times article Phlop I think nicely sums up the Phillies woes, but I think it is a little incomplete. Yes, the Phillies pitching went AWOL in June, but notice a big factor in the collapse of the Phillies pitching:
Anyone notice or comment on the fact that Jon Lieber hasn’t pitched for the team in a month and that his departure for injury reasons coincided with the team’s horrific pitching performance? Admittedly, Lieber’s stats weren’t great when he left 4.57 FIP ERA, but I felt that Lieber was a badly under-rated pitcher and that he was about to improve his performance significantly.
2) Pitching problems aside, I noticed that John Brattain didn’t note that the Phillies have played terrible defense thus far this season. I keep waiting for the Phillies to improve on defense, but their .671 DER is second-worst in the NL, just better than Pittsburgh (.662).
3) The Phillies offense has been pretty much the same as it has been all season: the Phils have been scoring runs, but they haven’t hit well with runners in scoring position. Two Phillies have had rough months in June, however …
Aaron Rowand has had a terrible month, with a .202 GPA and a .110 ISO. I’ve complained that Rowand is too much of a free-swinger and that his inability to draw walks with any consistency leaves him prone to hot-and-cold streaks at the plate. Here is a great example of that: in the month of June, Rowand had the lowest pitches-per-plate appearance of any Phillie.
And Rowand had the worst runs created per 27 outs of any Phillie (2.37). Worse even than David Bell (2.60).
Speaking of whom … David Bell hasn’t been that much better. His GPA is an atrocious .205, and his ISO is a laughable .027 … In 95 plate appearances he mustered three extra-base hits and none were home runs.
Aside from Bell and Rowand, the Phillies continued to hit in June. Sure, Pat Burrell only had a batting average of .194, but his ISO for the month was a tremendous .306 and his OBP was .326 … Burrell’s ability to draw walks (.163 BB/PA) saved him even while he struggled a little at the plate. Burrell is still getting the job done.
Confused about what I’m talking about? Here are the stats I refer to defined:
ISO (Isolated Power): .SLG - .BA = .ISO. Measures a player’s raw power by subtracting singles from their slugging percentage.
OBP (On-Base Percentage): How often a player gets on base. (H + BB + HBP) / (Plate Appearances)
BB / PA (Walks per plate appearance): (BB / PA = .BB/PA Avg)
SLG (Slugging Percentage): Power at the plate. (Total Bases / At-Bats = Slugging Percentage)
GPA (Gross Productive Average): (1.8 * .OBP + .SLG) / 4 = .GPA. Invented by The Hardball Times Aaron Gleeman, GPA measures a players production by weighing his ability to get on base and hit with power. This is my preferred all-around stat.
Runs Created: A stat originally created by Bill James to measure a player’s total contribution to his team’s lineup. Here is the formula ESPN (where I get it from) uses: [(H + BB + HBP - CS - GIDP) times (Total bases + .26[BB - IBB + HBP] + .52[SH + SF + SB])] divided by (AB + BB + HBP + SH+ SF). ESPN’s version is out-of-date, however, I’d note. James adjusted RC after the 2004 season ended.
RC/27: Runs Created per 27 outs, essentially what a team of 9 of this player would score in a hypothetical game.
FIP – Fielding Independent Pitching: (13*HR+3*BB-2*K / IP) + League Factor Evaluates a pitching by how he would have done with an average defense behind him by keeping track of things that a pitcher can control (walks, strikeouts, home runs allowed) as opposed to things he cannot (hits allowed, runs allowed).
DER – Defense Efficiency Ratio: (Batters Faced – (Hits + Walks + Hit By Pitch + Strikeouts)) / (Batters Faced – (Home Runs, Walks + Hit By Pitch + Strikeouts)) How often fielders convert balls put into play into outs.
4) I figured that Chase Utley and Ryan Howard would represent the Phillies in the NL All Star game. I was rather surprised to see Tom Gordon make the cut. Good for him! Notice who isn’t closing for the NL? Billy Wagner. I’m mildly surprised that Bobby Abreu won’t be at the All Star game … Seriously, Matt Holliday over Abreu? I don’t see it.
5) Is the season really lost for the Phillies? I doubt it. I’ve said that the Phillies will probably need to win ninety games to make the playoffs. At the mid-point, that means that the Phillies will have to go 53-28 (.654) the rest of the season to make that happen. I concede that this is asking a lot, but I might be wrong. As of this morning the Cincinnati Reds were leading the NL wildcard race with a 44-38 (.537) record. If you extrapolate that over a 162 game season, then the Reds will finish with 87 wins. So my estimate of how many games the Phillies need to win might be way off. As of right now, even with their horrific record in their last twenty-two games (5-17), the Phillies are just six and a half games out of a playoff berth.
The Phillies have played badly, but they’ll have to play much worse to play themselves out of the playoffs.
That is NOT a challenge! More Wednesday. Tomorrow I am busy grilling and chillin’.
![]()


