Friday, August 25, 2006
The Week Ahead: Mets, Marlins, Braves
 Last night’s 11-2 loss to the Chicago Cubs represents the second time this month the Phillies failed to complete a four-game sweep of an opponent. I am very disappointed, particularly given that Cole Hamels pitched so poorly, allowing five earned runs in two innings pitched (although four of the nine runs he allowed were unearned). I had really thought that having Cole on the mound was a near automatic ‘W’.
Opportunity squandered. The Reds 6-3 victory over the San Francisco Giants moves the Phillies right back to where they started: two and a half games out of first place.
The Phillies are set to open a three game series against the Mets at Shea Stadium tonight, their fifteenth consecutive day with a game. Monday will be the first time the Phillies have had a day off since August 10th. Playing seventeen consecutive days with a game, including road trips to New York and Chicago, have to wear on a team, so I expect that the Phillies won’t play particularly well this weekend. I’d figure on the Mets taking two of the three. I’d count a two-to-one split in favor of the Phillies a significant victory for the team.
This series will be the final time the Phillies play the Mets in 2006, unless the two teams meet up in the National League Championship Series (NLCS) in October. I have no idea why the schedule-makers elected to stick ten games between the Phillies and Mets in August and leave them out of September. Did they figure that the Phillies wouldn’t have a shot to contend? Similarly, I haven’t a clue why they elected to stick ten games against the Marlins in September and not have the Phillies play them since late July. Wouldn’t it have made more sense to have the Phillies close off the season with the Braves or Mets, figuring that they’d be a likely foe for a playoff berth? Heightening the drama and all?
After this series I am oddly optimistic about the Phillies schedule down the stretch. I say oddly because the Phillies recent history doesn’t suggest they have much of a shot to make it into October. Here is who they play after they wrap up with the Mets:
Games Against / Opp. Win Pct.
Florida Marlins: 10 / .476
Atlanta Braves: 7 / .468
Houston Astros: 6 / .472
Washington Nationals: 6 / .425
Chicago Cubs: 3 / .421
How do you like that schedule? After this weekend the Phillies don’t play a single team with a winning record. This is a very favorable schedule for the Phillies, though I’d almost be more comfortable playing a team we’ve historically had success against, like the Mets, as opposed to the Marlins, who seem to have cast some sort of spell over the Phillies in seasons past.
Seven of the Phillies games down the stretch are against the Braves, that sinking juggernaut that dominated this division for so long. As everyone who reads this blog knows, I loathe the Braves, their bland dominance of the NL East over the last decade has made baseball boring, and their GM is an arrogant ignoramus. (See, my review of his book, “Built to Win”.) So the sight of the Braves crawling their way to a losing record fills me with joy. I hope the Phillies win all three and the Braves finish with 90+ losses this season. “Built to Win” my a--.
What is particularly stunning about the Phillies schedule is that ten of their last twenty-two games are against the Marlins! Nothing against the Fishstripes, who have performed much better than expected in this rebuilding year, but they aren’t doing that well this season. It has been a while since the Phils have played them. Thus far this season the Phillies are 6-4 against the Marlins. They seem to be a pretty middling team and don’t seem to be making any sort of a run to the post-season, so the Phillies should be able to blitz through those final games with the wildcard within their grasp.
Wildcard Watch! Here are the current standings:
Wildcard Standings:
1. Cincinnati: 67-61
2. San Diego: 65-62 (1.5)
3. Philadelphia: 65-62 (2.5)
4. Arizona: 62-65 (4.5)
5. Milwaukee: 62-65 (4.5)
6. San Francisco: 62-66 (5.0)
7. Florida: 60-66 (6.0)
8. Atlanta: 59-67 (7.0)
9. Houston: 60-68 (7.0)
10. Colorado: 59-68 (7.5)
The Phillies drop back to two and a half games back while the backside of the top ten are starting to slide out of contention. Stay tuned.
Thursday, August 24, 2006
Spotlight on J.Roll
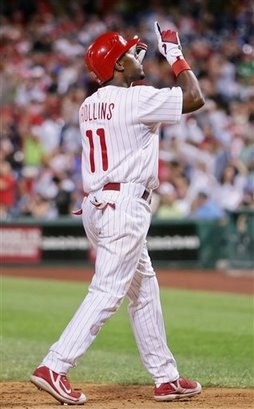 What’s up with Jimmy Rollins? His 2006 campaign has been a real roller-coaster. He’s had tremendous highs, like last night’s clutch double to give the Phillies a 2-1 win in Chicago over and the Cubs and tremendous lows. At the beginning of the year his epic hitting streak came to rest at 38 games and he seemed to slump badly after that. The strain of chasing Joe DiMaggio, of getting a hit each week, gave J.Roll, in my opinion, bad habits. He became less patient at the plate, became more of a free-swinger. He struggled for the spring and started to regain his old form for June and July, before turning his game up a notch after the All-Star Break. Check out J.Roll’s GPA by month:
April: .241
May: .234
June: .266
July: .273
August: .306
Season: .268
Confused about what I’m talking about? Here are the stats I refer to defined:
Gross Productive Average (GPA): (1.8 * .OBP + .SLG) / 4 = .GPA. Invented by The Hardball Times Aaron Gleeman, GPA measures a players production by weighing his ability to get on base and hit with power. This is my preferred all-around stat.
Isolated Power (ISO): .SLG - .BA = .ISO. Measures a player’s raw power by subtracting singles from their slugging percentage.
On-Base Percentage (OBP): How often a player gets on base. (H + BB + HBP) / (Plate Appearances)
Walks per plate appearance (BB/PA): BB / PA = .BB/PA Avg
Slugging Percentage (SLG): Total Bases / At-Bats = Slugging Percentage. Power at the plate.
Jimmy Rollins is an exceptional talent and we’ll be seeing him for a long, long time to come. At just 27, he’s in the middle of his sixth full MLB season. I’ve always been frustrated by him because he is maddeningly inconsistent. Lead-off hitters are supposed to do one thing in my opinion: get on base. Set the table. If I were building an MLB team my lead-off guy would be an OBP machine. I think the Red Sox decision to bat Kevin Youkilis, the Greek God of Walks, first is brilliant. Sure, Youkilis has little speed (five stolen bases in seven tries, mostly the product of failed hit-and-runs, I suspect) but he gets on base (.390 OBP) and sets the table for the rest of the team.
J.Roll isn’t like that. He’s sort of like Ricky Henderson. He’s got speed on the base paths:
Stolen Bases / Success Pct.
2001: 46 / 85%
2002: 31 / 71%
2003: 20 / 63%
2004: 30 / 77%
2005: 41 / 87%
2006: 29 / 88%
Career: 200 / 79%
And he’s got power at the plate:
ISO
2001: .145
2002: .135
2003: .124
2004: .166
2005: .142
2006: .189
Career: .147
That rare combination of speed and power makes J.Roll a terrific weapon at the top of the order. With one swing of the bat he could start a game with giving the Phillies a 1-0 lead. What is more depressing for a pitcher than surrendering a lead-off home run?
J.Roll’s problem is that he really doesn’t do a good job of getting on base, which is what a lead-off hitter’s #1 job ought to be. Phillies lead-off hitters – i.e. J.Roll – rank twelvth in the NL in OBP, and tenth in walks drawn. This has been a consistent problem throughout J.Roll’s career. His ability to set the table isn’t what it ought to be. He is far too reliant on his ability to put the ball into play and get a hit off of his bat. J.Roll’s career high in walks is just 57. The Sox’ Youkilis has 73 right now and has another forty games left to play. J.Roll just doesn’t work the count enough and get those bases on balls. His 3.7 pitches per plate appearance is one of the worst on the Phillies, and, astonishingly enough, an improvement over previous seasons: he averaged just 3.4 in 2004 and 2005. To his credit, he has reduced his strikeout problem considerably since 2003:
2001: 108
2002: 103
2003: 113
2004: 73
2005: 71
2006: 57
So the problem with J.Roll isn’t that he has a bad eye: he lowered his strikeouts and got better at making contact with the ball. He’s just foregone working count in favor of putting the ball into play. He’s got power at the plate and he makes good use of it. While the Phillies lead-off hitters rank at the bottom in terms of getting on base, meanwhile they rank third in the NL in slugging percentage and second in Home Runs per At-Bat.
At the moment everything is clicking for Jimmy Rollins. In the last month he’s gone 35-for-98 (.357) with six doubles, a triple and seven home runs, twenty-three RBIs and twelve walks. His August slugging percentage has been .653, which is terrific. He’s a streaky player and this month everything is coming up aces for him. This is an odd trend for J.Roll: he seems to really pick up the pace and turn things on at the end of the season. If that holds true than the Phillies have a real weapon in their arsenal in their push for the playoffs.
Let’s see how J.Roll does. Am I thrilled that J.Roll is the Phillies lead-off man? No. I’d prefer to see someone with skill at drawing walks occupying that position. But J.Roll is a solid shortstop and his power numbers do make a good argument for him staying with the Phillies. Plus the Phillies seem set on keeping J.Roll around for a long, long time. Keep it up J.Roll.
Wildcard Watch! Here are the current standings:
Wildcard Standings:
1. Cincinnati: 66-61
2. San Diego: 65-62 (1.0)
3. Philadelphia: 64-62 (1.5)
4. Arizona: 62-65 (4.0)
5. San Francisco: 62-65 (4.0)
6. Milwaukee: 61-65 (4.5)
7. Florida: 60-66 (5.5)
8. Houston: 60-67 (6.0)
9. Atlanta: 59-67 (6.5)
10. Colorado: 59-67 (6.5)
Thanks to the Reds 7-3 loss to the Houston Astros last night the Phillies were able to convert their 2-1 win over the Cubs into making up real ground in the wildcard race, closing to within a game and a half of the Reds. As I see it, the wildcard race is starting to shape up into a three-way contest between the Phils, Reds and Pads. It seems like Arizona, San Francisco, Florida and the rest are starting to fall off the pace a little. Today Cole Hamels goes against Zombrano to make it a four-game sweep. Not to be cocky, but when Cole Hamels pitches, it is money in the bank.
Wednesday, August 23, 2006
Unconventional Wisdom
Yesterday I was reading that Aaron Rowand might be done for the season with the Phillies. The article I was reading pitched Rowand’s injury as a major loss for the Phillies in their quest for the wildcard because Rowand was having a “brilliant” season for the Phillies defensively. The Inquirer’s Todd Zolecki chimed in and stated that “there is no question that Rowand’s loss is a blow.” That is the conventional wisdom.
The reality is that the Phillies quest for the post-season probably got a major boost with Rowand’s injury.
Let’s first dispose of the idea that Rowand has been a terrific defensive performer for the Phillies. Check out Zone Rating for NL Centerfielders:
Zone Rating:
1. Beltran (Mets): .912
2. Pierre (Cubs): .908
3. Byrnes (Dbacks): .906
4. Taveras (Astros): .895
5. Cameron (Pads): .894
6. Edmonds (Cards): .892
7. Finley (Giants): .885
8. Sullivan (Rockies): .862
9. Rowand (Phillies): .857
10. Lofton (Dodgers): .854
11. Jones (Braves): .852
12. Clark (Brewers): .852
13. Griffey (Reds): .810
Confused about what I’m talking about? Here are the stats I refer to defined:
Zone Rating (ZR): Is a stat which measures a player’s defensive ability by measuring plays they should have made. Admittedly, this is a stat left open to subjective opinions.
And this actually represents some improvement on Rowand’s part: he had actually been ranked eleventh at one point earlier in the season. The bottom-line is that Rowand, that terrific catch back in the spring where he injured himself notwithstanding, has been having a terrible season for the Phillies as their centerfielder. Why, I do not know. He had a terrific season for the White Sox as a fielder, which is the whole reason why the Phillies dealt to bring him on board, but for this season he has been having a terrible time in the outfield. Getting used to playing center at Citizens? Who knows.
So here I am going to engage in a bit of supposition: Shane Victorino, Rowand’s replacement in center, will play better baseball than Aaron Rowand. I have no numbers to back that up because Victorino has played so little in the outfield but from what I’ve seen Victorino cannot do a worse job than Rowand has this season. In the interest of complete candor I have to concede that Victorino rates lower than Rowand in Zone Rating in centerfield this season:
Zone Rating / Innings
Rowand: .857 / 901 & 2/3
Victorino: .833 / 221 & 1/3
Of course Victorino has played less than a fourth of the innings Rowand has, so those numbers are a little unreliable. I do think Victorino will play well in center these next few weeks. I’ll check back and see if those numbers change.
The other reason why I dispute the conventional wisdom is one that I hesitate to make, because my readers are very familiar with my list of grievances regarding Aaron Rowand’s performance at the plate in 2006, but I’ll make the point again (briefly):
Rowand is screwing up the Phillies offense big time. He had a career year in 2004 for the White Sox which won’t be repeated: .298 GPA / .234 ISO / 24 Home Runs / 92 Runs Created. Those numbers took a significant dive in 2005: .250 GPA / .137 ISO / 13 Home Runs / 78 Runs Created. And they aren’t doing much better right now: .251 GPA / .163 ISO / 12 Home Runs / 45 Runs Created. Rowand’s problem is that he is a free-swinger who strikes out too much and doesn’t draw enough walks. To-wit, thus far this season Aaron Rowand is drawing .040 walks per plate appearance. That is the worst on the the Phillies amongst regulars and worse than some of the Phils pitchers (e.g., Cole Hamels: .167). Rowand’s 3.40 pitches per plate appearance is also the worst amongst the regulars.
Confused about what I’m talking about? Here are the stats I refer to defined:
Gross Productive Average (GPA): (1.8 * .OBP + .SLG) / 4 = .GPA. Invented by The Hardball Times Aaron Gleeman, GPA measures a players production by weighing his ability to get on base and hit with power. This is my preferred all-around stat.
Isolated Power (ISO): .SLG - .BA = .ISO. Measures a player’s raw power by subtracting singles from their slugging percentage.
On-Base Percentage (OBP): How often a player gets on base. (H + BB + HBP) / (Plate Appearances)
Walks per plate appearance (BB/PA): BB / PA = .BB/PA Avg
Slugging Percentage (SLG): Total Bases / At-Bats = Slugging Percentage. Power at the plate.
Runs Created (RC): A stat originally created by Bill James to measure a player’s total contribution to his team’s lineup. Here is the formula: [(H + BB + HBP - CS - GIDP) times ((S * 1.125) + (D * 1.69) + (T * 3.02) + (HR * 3.73) + (.29 * (BB + HBP – IBB)) + (.492 * (SB + SF + SH)) – (.04 * K))] divided by (AB + BB + HBP + SH+ SF). If you use ESPN’s version be advised that it is pitifully is out-of-date, however. James adjusted RC after the 2004 season ended.
The problem with Rowand’s aggressive approach to offense is that he relies purely on his ability to make contact and put the ball into play. The problem with that is that plays who don’t draw walks don’t get on base consistently and don’t produce for their teams. That makes Rowand a maddeningly inconsistent player to watch at the plate. He might have a run of luck, and then go 0-for-sixteen and not get on base for five or six consecutive games. Victorino is a much more consistent player and I’m sure he’ll improve on his numbers with the expanded playing time.
Bottom-line: the conventional wisdom about Rowand’s injury being a big blow to the Phillies post-season chance is a load of bull. He’s really not producing much for the Phils and arguably his replacement, Shane Victorino, is going to play better than him. The Phillies will keep right on going and not skip a beat, just as they did last night in Chicago with their 6-3 win over the Cubs.
Today we are going to start with a regular feature on A Citizens Blog: Wildcard Watch! Here are the current standings:
Wildcard Standings:
1. Cincinnati: 66-60
2. San Diego: 64-62 (2.0)
3. Philadelphia: 63-62 (2.5)
4. Arizona: 62-64 (4.0)
5. San Francisco: 61-65 (5.0)
6. Milwaukee: 60-65 (5.5)
7. Atlanta: 59-66 (6.5)
8. Colorado: 59-66 (6.5)
9. Florida: 59-66 (6.5)
Stay tuned.
(4) comments
The reality is that the Phillies quest for the post-season probably got a major boost with Rowand’s injury.
Let’s first dispose of the idea that Rowand has been a terrific defensive performer for the Phillies. Check out Zone Rating for NL Centerfielders:
Zone Rating:
1. Beltran (Mets): .912
2. Pierre (Cubs): .908
3. Byrnes (Dbacks): .906
4. Taveras (Astros): .895
5. Cameron (Pads): .894
6. Edmonds (Cards): .892
7. Finley (Giants): .885
8. Sullivan (Rockies): .862
9. Rowand (Phillies): .857
10. Lofton (Dodgers): .854
11. Jones (Braves): .852
12. Clark (Brewers): .852
13. Griffey (Reds): .810
Confused about what I’m talking about? Here are the stats I refer to defined:
Zone Rating (ZR): Is a stat which measures a player’s defensive ability by measuring plays they should have made. Admittedly, this is a stat left open to subjective opinions.
And this actually represents some improvement on Rowand’s part: he had actually been ranked eleventh at one point earlier in the season. The bottom-line is that Rowand, that terrific catch back in the spring where he injured himself notwithstanding, has been having a terrible season for the Phillies as their centerfielder. Why, I do not know. He had a terrific season for the White Sox as a fielder, which is the whole reason why the Phillies dealt to bring him on board, but for this season he has been having a terrible time in the outfield. Getting used to playing center at Citizens? Who knows.
So here I am going to engage in a bit of supposition: Shane Victorino, Rowand’s replacement in center, will play better baseball than Aaron Rowand. I have no numbers to back that up because Victorino has played so little in the outfield but from what I’ve seen Victorino cannot do a worse job than Rowand has this season. In the interest of complete candor I have to concede that Victorino rates lower than Rowand in Zone Rating in centerfield this season:
Zone Rating / Innings
Rowand: .857 / 901 & 2/3
Victorino: .833 / 221 & 1/3
Of course Victorino has played less than a fourth of the innings Rowand has, so those numbers are a little unreliable. I do think Victorino will play well in center these next few weeks. I’ll check back and see if those numbers change.
The other reason why I dispute the conventional wisdom is one that I hesitate to make, because my readers are very familiar with my list of grievances regarding Aaron Rowand’s performance at the plate in 2006, but I’ll make the point again (briefly):
Rowand is screwing up the Phillies offense big time. He had a career year in 2004 for the White Sox which won’t be repeated: .298 GPA / .234 ISO / 24 Home Runs / 92 Runs Created. Those numbers took a significant dive in 2005: .250 GPA / .137 ISO / 13 Home Runs / 78 Runs Created. And they aren’t doing much better right now: .251 GPA / .163 ISO / 12 Home Runs / 45 Runs Created. Rowand’s problem is that he is a free-swinger who strikes out too much and doesn’t draw enough walks. To-wit, thus far this season Aaron Rowand is drawing .040 walks per plate appearance. That is the worst on the the Phillies amongst regulars and worse than some of the Phils pitchers (e.g., Cole Hamels: .167). Rowand’s 3.40 pitches per plate appearance is also the worst amongst the regulars.
Confused about what I’m talking about? Here are the stats I refer to defined:
Gross Productive Average (GPA): (1.8 * .OBP + .SLG) / 4 = .GPA. Invented by The Hardball Times Aaron Gleeman, GPA measures a players production by weighing his ability to get on base and hit with power. This is my preferred all-around stat.
Isolated Power (ISO): .SLG - .BA = .ISO. Measures a player’s raw power by subtracting singles from their slugging percentage.
On-Base Percentage (OBP): How often a player gets on base. (H + BB + HBP) / (Plate Appearances)
Walks per plate appearance (BB/PA): BB / PA = .BB/PA Avg
Slugging Percentage (SLG): Total Bases / At-Bats = Slugging Percentage. Power at the plate.
Runs Created (RC): A stat originally created by Bill James to measure a player’s total contribution to his team’s lineup. Here is the formula: [(H + BB + HBP - CS - GIDP) times ((S * 1.125) + (D * 1.69) + (T * 3.02) + (HR * 3.73) + (.29 * (BB + HBP – IBB)) + (.492 * (SB + SF + SH)) – (.04 * K))] divided by (AB + BB + HBP + SH+ SF). If you use ESPN’s version be advised that it is pitifully is out-of-date, however. James adjusted RC after the 2004 season ended.
The problem with Rowand’s aggressive approach to offense is that he relies purely on his ability to make contact and put the ball into play. The problem with that is that plays who don’t draw walks don’t get on base consistently and don’t produce for their teams. That makes Rowand a maddeningly inconsistent player to watch at the plate. He might have a run of luck, and then go 0-for-sixteen and not get on base for five or six consecutive games. Victorino is a much more consistent player and I’m sure he’ll improve on his numbers with the expanded playing time.
Bottom-line: the conventional wisdom about Rowand’s injury being a big blow to the Phillies post-season chance is a load of bull. He’s really not producing much for the Phils and arguably his replacement, Shane Victorino, is going to play better than him. The Phillies will keep right on going and not skip a beat, just as they did last night in Chicago with their 6-3 win over the Cubs.
Today we are going to start with a regular feature on A Citizens Blog: Wildcard Watch! Here are the current standings:
Wildcard Standings:
1. Cincinnati: 66-60
2. San Diego: 64-62 (2.0)
3. Philadelphia: 63-62 (2.5)
4. Arizona: 62-64 (4.0)
5. San Francisco: 61-65 (5.0)
6. Milwaukee: 60-65 (5.5)
7. Atlanta: 59-66 (6.5)
8. Colorado: 59-66 (6.5)
9. Florida: 59-66 (6.5)
Stay tuned.
Tuesday, August 22, 2006
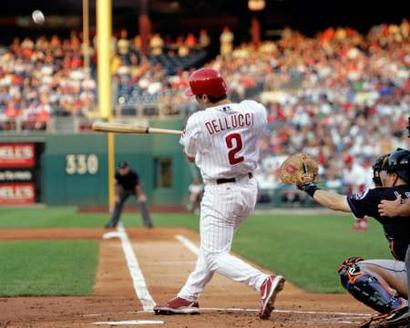
Spotlight on David Dellucci
 At the risk of saying something that sounds insanely random, I’ve never liked the number two. I don’t like how it looks on players uniforms. And how often do sequels stink? (“City Slickers 2”?; “Basic Instinct 2”?) Good sequels will at least put theirs in roman numerals (e.g., “The Godfather, Part II”). And John Adams, contrary to David McCullough’s … well, “John Adams”, was a terrible President. Which number was he? #2.
And Derek Jeter is #2. ‘Nuff said.
With all of that said, I was prepared to dislike David Dellucci strictly because he wore the #2. That and he also played for the Rangers and seemed to me, after a cursory glance at his career stats, to be a one-dimensional slugger.
I have to admit that I couldn’t be more wrong. Dellucci is turning out to be a terrific player and I sincerely hope that the Phillies make a major effort to resign him in the off-season and bring him back as their starting right-fielder in 2007. If the Phillies make the playoffs as a wildcard I would credit Dellucci’s sterling play down the stretch as a major factor.
So what has David Dellucci done for the 2006 season? Let’s start with his sterling August performance thus far:
OBP: .519
SLG: .786
ISO: .381
GPA: .379
HR: 5
RBI: 12
BB/K: 10/5
Confused about what I’m talking about? Here are the stats I refer to defined:
Gross Productive Average (GPA): (1.8 * .OBP + .SLG) / 4 = .GPA. Invented by The Hardball Times Aaron Gleeman, GPA measures a players production by weighing his ability to get on base and hit with power. This is my preferred all-around stat.
Isolated Power (ISO): .SLG - .BA = .ISO. Measures a player’s raw power by subtracting singles from their slugging percentage.
On-Base Percentage (OBP): How often a player gets on base. (H + BB + HBP) / (Plate Appearances)
Slugging Percentage (SLG): Total Bases / At-Bats = Slugging Percentage. Power at the plate.
This is an August that players dream about. Dellucci has gotten some real playing time now that Bobby Abreu has moved on and Charlie Manuel seems intent on resting Pat Burrell whenever possible. Dellucci has responded by delivering much-needed power to the Phillies lineup. Bobby Abreu, for all of his considerable skill at the plate, was not a power hitter. His ISO with the Phillies this season was just .157, well off the team average of .182, and off of the league average of .163. Thus far with the Yankees he’s continued this downward trend, lowering his ISO to just .114.
For all of Bobby’s talents you have to wonder if the Phillies aren’t better off with him out of top of the order and a player with Dellucci’s skills into the lineup. Bobby worked the count and got on base, but he never advanced runners home the way he ought to as the clean-up hitter. David is a power hitter who advances runners. It may be sacrilegious to say this, but maybe the Phillies offense is functioning better without Bobby than with him because now the Phillies won’t have an OBP machine hitting third or fourth, instead of first or second, which is where Bobby should have been hitting but didn’t want to. Now the Phillies have a powerful bat advancing the runners. Instead of drawing a walk when there is a runner on second, as Abreu might do, now Dellucci smashes a home run or a double and gets the guy around to home.
It is a theory. What is fact is that Dellucci is a terrific slugger. Check out his slugging percentages from the previous seasons:
SLG:
2004: .441
2005: .513
2006: .634
Career: .455
Let’s take a look at ISO to see how powerful his bat has really been:
ISO:
2004: .199
2005: .262
2006: .301
Career: .190
That is pretty good. What is even more impressive to me is the fact that Dellucci is slightly older than Abreu (six months), and yet while Bobby has seems to have lost power at the plate, Dellucci has discovered it.
However, Dellucci is not a one-dimensional player. He is rather adept at working the count and drawing walks. Note that this month he has twice as many walks (10) as strikeouts (5). Look at the last three seasons to see how skilled Dellucci is at drawing walks:
BB/PA:
2004: .121
2005: .147
2006: .100
Career: .106
Walks per plate appearance (BB/PA): BB / PA = .BB/PA Avg
That is pretty impressive. Unlike a free-swinger like Aaron Rowand, for example, Dellucci understands the importance of working a count. Look at his pitches-per-plate appearance:
P / PA:
2004: 4.1
2005: 4.2
2006: 4.0
This season Dellucci is one of the Phillies most patient batters. He is tied for third on the team in pitches-per-plate appearance with Ryan Howard, just behind Bobby Abreu and Pat Burrell:
P / PA:
Abreu: 4.2
Burrell: 4.1
Howard: 4.0
Dellucci: 4.0
Utley: 3.9
Coste: 3.8
Rollins: 3.7
Nunez: 3.7
Bell: 3.7
Victorino: 3.5
Rowand: 3.4
Lieberthal: 3.2
The Phillies are, collectively, the third most patient team of batters in the NL, drawing 3.83 pitches per plate appearance. I think that patience is a major factor in why the Phillies are the best offensive team in the NL: no team wears down a pitcher better than the Phillies, drawing walks and forcing the opposition to exhaust themselves trying to get outs. What I like about Dellucci is that he is a “grinder”, someone who makes the pitcher work for his outs, but unlike Bobby Abreu, he doesn’t seem to sacrifice power to draw walks and lengthen at-bats.
The Phillies offense is arguably much more potent with Dellucci replacing Abreu: I looked at Runs Created per 27 Outs and I was surprised by what I saw:
RC/27
Coste: 9.9
Abreu: 8.3
Dellucci: 8.2
Howard: 7.7
Utley: 7.5
Burrell: 6.1
Runs Created (RC): A stat originally created by Bill James to measure a player’s total contribution to his team’s lineup. Here is the formula: [(H + BB + HBP - CS - GIDP) times ((S * 1.125) + (D * 1.69) + (T * 3.02) + (HR * 3.73) + (.29 * (BB + HBP – IBB)) + (.492 * (SB + SF + SH)) – (.04 * K))] divided by (AB + BB + HBP + SH+ SF). If you use ESPN’s version be advised that it is pitifully is out-of-date, however. James adjusted RC after the 2004 season ended.
RC/27: Runs Created divided by outs made, multiplied by 27. Essentially what a team of 9 of this particular player would score in a hypothetical game.
The result changes if we work off of an alternative stat called BaseRuns:
BsR/27:
Abreu: 7.20
Dellucci: 8.72
Base Runs:
A: H + BB + HBP – HR
B: (.8 * 1B) + (2.1 * 2B) + (3.4 * 3B) + (1.8 * HR) + (.1*(BB + HBP))
C: AB – H
D: HR
Then simply divide B into B + C, then multiply A to the result and add D.
I will caution that while I like Base Runs, partly because it has an easier formula, it is a little more biased towards power hitting and Runs Created might give a more accurate and balanced picture of how a player contributes to his team.
Two last points before I wrap up. First, Dellucci’s bat is far more economical for the Phillies to have than Abreu’s. Here are their 2006 salaries:
Abreu: $13,000,000
Dellucci: $995,000
Bobby Abreu’s salary goes up to $15 million in 2007, so the Phillies made a smart, smart play by going out and pawning him off on the
 Yankees. Yes, it was little more than a salary dump, and the players the Phillies got in the deal may never turn out to be major leaguers, but the Phillies did the right thing by getting Bobby’s salary off the books. Dellucci is apparently a free agent in the off-season and apparently expressed disinterest in re-signing with the Phillies, but I think that the Phillies might be able to keep him. Even if the Phillies have to triple his salary for 2007, it would be worth it. They would get a player who could contribute 80% to 100% of what Bobby does for just 20% of the price.
Second, David Dellucci is a much, much better fielder than Bobby Abreu. I am going to quote, verbatim, The Fielding Bible’s assessment of Dellucci: “[He] plays without fear in the outfield will go to any length, even physical harm, to make a catch. He can play all three outfield positions but he profiles best in left field because of his poor throwing arm. He doesn’t cover enough ground for center and his arm is too weak for right.” So yes, Dellucci might be a better bet to replace Pat Burrell, but I bet he could play right in a pinch if the Phillies don’t deal Burrell in the off-season. (If they do I’d expect to see Dellucci in left, Victorino in right and Rowand in center in 2007.) There is little doubt that Dellucci would be a better right fielder, even with a suspect arm, than Abreu. Once more I will quote from The Fielding Bible, this time on Abreu: “[Abreu] has been accused of having lapses in concentration, fear of diving for balls or running into walls on the warning track, and just not giving a maximum effort in the field. He often gets bad jumps on the ball and in the past has let a lot of balls get in front of him.” All of this was said in an assessment that mocked baseball’s decision to award Bobby a 2005 Gold Glove. Phillies fans who have seen Abreu flounder in the field know this is correct and accurate. He is a terrible fielder. George Will once asked, in the context of why the Hall of Fame was reluctant to elect Richie Ashburn to the Hall, why a double denied on defense wasn’t as admired or appreciated as a double hit at the plate. When considering Bobby’s replacement, why not factor Dellucci’s enthusiasm on defense into the equation? He may not be the best right fielder, but he’s going to try and surely he couldn’t have done worse than Abreu did.
In the final analysis, I hope that the Phillies make a major effort to re-sign Dellucci in the off-season. He is a terrific player and is rapidly becoming a vital cog in the Phillies march (hopefully) towards the post-season.
The Phillies continue to hang in the wildcard race, advancing to third now, two & 1/2 games back of the Reds. Let's hope the Reds lose one of these days!
Monday, August 21, 2006
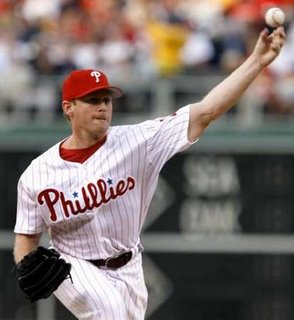
Spotlight on Pitching
The subtitle for this article is: “Why the Phillies pitching is better than you think.”
Everyone hates the Phillies pitching. Pat Gillick busted on the Phillies pitching at the start of the season, and every pundit loves to assail the Phillies pitchers. This is a team that is built for offense and plays in a park that optimizes offense, everyone assumes. Since the Phillies moved from the Vet to Citizens Bank Ballpark they’ve been one of the worst pitching teams in the majors. Despite having real talent in the rotation over the last few campaigns, with players like Kevin Millwood and Vicente Padilla, the Phillies have been abysmal on the mound.
I think the problem in perception began when the Phillies brought Eric Milton on board as their ace for the 2004 season. Milton got off to a great start on paper, going 11-2 prior to the All-Star break and garnering indignant outrage when the Marlins Jack McKeon (correctly) elected to keep him off the All-Star team.
Milton was a nightmare. Milton was the winner of far too many 8-6 slugfests where the Phillies triumphed despite him, not because of him. Milton surrendered 1.83 home runs every nine innings before the break and 2.02 every nine innings after. His ERA at the break was a catastrophic 4.72. Milton’s problem was that he was a flyball pitcher who would have survived well at Yankees Stadium or Turner Field, but was poison at Citizens. (Although, I should note that Milton surrendered more home runs on the road than at home.) Milton was run out of town at the end of the season, as the Phillies tried to adapt to Citizens by switching to a staff manned with groundball pitchers. But the perception that Citizens was a pitcher-killer the same way Coors Field in Denver is has persisted. Call it The Curse of Eric Milton.
So the conventional wisdom is that the Phillies have a lousy pitching staff. True? Yes and no. Certainly the 2006 campaign has been rough on the Phillies. They’ve been inconsistent for the year:
ERA / WHIP
April: 5.03 / 1.56
May: 3.85 / 1.34
June: 5.80 / 1.64
July: 5.00 / 1.43
August: 3.71 / 1.18
Season: 4.74
They actually did halfway well for May and August and were atrocious in April, June and July:
By Month: ERA rank / Team Winning PercentageApril: 14th / (.417)
May: 5th / (.607)
June: 14th / (.333)
July: 10th / (.520)
August: 6th / (.625)
Season: 13th (.492)
Confused about what I’m talking about? Here are the stats I refer to defined:
WHIP – Walks plus hits by innings pitched: (BB + H) / IP = WHIP
ERA – Earned Run Average: (Earned Runs * 9) / IP = ERA
FIP – Fielding Independent Pitching: (13*HR+3*BB-2*K / IP) + League Factor Evaluates a pitching by how he would have done with an average defense behind him by keeping track of things that a pitcher can control (walks, strikeouts, home runs allowed) as opposed to things he cannot (hits allowed, runs allowed).
DER – Defense Efficiency Ratio: (Batters Faced – (Hits + Walks + Hit By Pitch + Strikeouts)) / (Batters Faced – (Home Runs, Walks + Hit By Pitch + Strikeouts)) How often fielders convert balls put into play into outs.
Hr/9 – Home Runs allowed per nine innings: (HR * 9) / IP
K/9 – Strikeouts per nine innings: (K * 9) / IP
BB/9 – Walks per nine innings: (BB * 9) / IP
The month of August, thus far, suggests that the Phillies pitching staff is on an upswing. I have a couple of reasons why:
1. The addition of Cole Hamels.
2. The subtraction of Gavin Floyd and Ryan Madson from the rotation.
3. The return of Randy Wolf
4. Brett Myers and Jon Lieber’s second wind.
I’ve resisted the temptation of engaging in Cole Hamels hype for a long time, but now I feel tempted to begin every column with “Isn’t Cole Hamels awesome? …”
Cole Hamels is a revelation and if he isn’t in the running for NL Rookie of the Year at the end of the season, I will formally demand a recount. Cole has done a great job thus far this season. Scope out some of the numbers:
FIP ERA K/9 BB/9 HR/9
Hamels: 3.86 10.5 3.5 1.2
Phillies: 4.63 6.8 3.3 1.3
National League: 4.51 6.6 3.4 1.1
Cole has been phenomenal with keeping the ball in the park, striking the opposition out and limiting their ability to put the ball into play. I feel like a prattal enough about Hamels, so I’ll move on after I note the improvement in Hamel’s ERA of late:
May: 3.18*
June: 6.49
July: 6.04
August: 0.86
* in just two starts.
 All of that suggests to me that Hamels is really starting to come into his own and be the terrific pitcher that most suspected he would be all along.
The subtraction of Gavin Floyd and Ryan Madson from the Phillies pitching staff (or in the case of Madson, his relegation to the bullpen) has been a major boon. Simply put, Gavin Floyd was unprepared mentally to pitch for the Phillies in 2006 and they ought to have known. He did terrible, hurling a 7.29 ERA (6.95 FIP ERA), allowing an Eric Milton-like two home runs every nine innings, and generally killing the Phillies every time he pitched. Ryan Madson did no better: 5.64 ERA (5.12 FIP), 1.4 Home Runs per nine innings. To be fair, Madson seems to be the victim of sloppy defense (.653 DER behind him), although part of that might be his fault (he’s allowing 22.2% of the balls put in play against him to be line-drives).
Gavin Floyd hasn’t pitched for the Phillies since June, and Ryan Madson was permanently moved into the bullpen in August after two efforts to make him a starter failed. Madson pitched well in August, entering seven games in relief, throwing 11& 1/3 innings, allowing just a 2.45 ERA, and two walks while striking out thirteen batters. I think this is a role he is ideally suited for and has had success at. If he accepts the move to the ‘pen, then I think he’ll find success. He needs to think of himself as a latter-day Jim Konstanty, the Phillies pitcher who won the 1950 NL MVP awards largely due to his clutch pitching, where he went 16-7 in a relief role, finishing over sixty games for the Phillies, often preserving fragile leads during the Phillies run to the pennant in 1950.
Randy is back. After injuring his arm in 2005, I never expected to see Randy Wolf back with the Phillies. I figured that the team would cut him loose, but I am happy to see that didn’t happen. Wolf has been hurling alright. His ERA is a decent 4.35, but that masks a much higher 5.84 FIP ERA. What gives me confidence that Wolf will pitch well is that he seems determined to show that he’s capable of contributing to the Phillies and his arm is fresh and ready to go. Another promising sign of the season is that Wolf is allowing just 16.1% of the balls put into play against him to be line-drives, a pretty low percent that is probably a factor in the Phillies impressive .746 DER behind him.
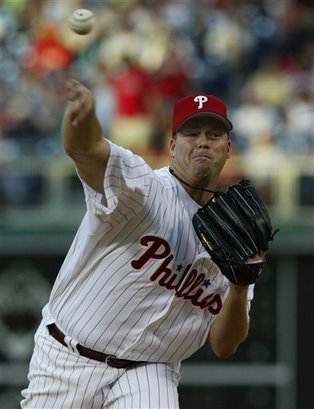
I don’t really care for Brett Myers the person, given what I read about the incident where he beat his wife in the street in Boston (particularly damaging to me was the quote from the 911 call where Kim Myers allegedly wailed that she wouldn’t allow him to beat her anymore, suggesting that this wasn’t a one-time incident and that Brett has serious anger management issues). Brett Myers the baseball player might be ready to make a big impact for the Phillies down the stretch, although his horrible August suggests otherwise. He is a terrific pitcher, the Phillies 2005 ace, and he could really help the team down the stretch if his mind is right. He's had a decent season thus far, given all that has transpired:
Myers: 4.21 FIP ERA, 17.7% Line-Drives, 8.3 K/9, 2.9 BB/9, 1.4 HR/9
I can’t say that I’m rooting for him (not being a big fan of big guys who pummel their little wives and all), but I hope that he contributes to the team.
I’ve long defended Jon Lieber and, to a lesser extent, the now departed Cory Lidle, as being pitchers who don’t get their due. Solid, unspectacular sinkerball pitchers, they get the job done without the flashy strikeouts. So I’m ready to make a bold prediction: Jon Lieber is going to have a phenomenal August and September for the Phillies.
I was very disappointed to watch Jon Lieber struggle when he joined the Phillies for the 2005 season. Prior to the All-Star break Lieber seemed to get pummeled, surrendering far too many home runs, allowing far too many walks and generally allowing the opposition to do what he was hired not to do: give up home runs and walks. When the Phillies signed Lieber in ’05, I was excited to see Lieber pitch because of what he did with the Yankees in 2004: 18 walks allowed and 20 home runs allowed in 176 & 2/3 innings pitched. The Home Runs allowed isn’t bad, that is basically a home run allowed every nine innings (1.02 HR/9). In terms of walks, that is astonishing. He allowed just 0.92 walks per nine innings. Lieber could go two or three starts without allowing a walk. Lieber would do well, I was certain, because of that ability to keep the ball in the park and keep runners off the base-paths. It didn’t work out that way in 2005. Lieber’s walks spiked to 1.69 BB/9, and his home runs went to 1.36 HR/9. But if you looked closely, you could see that this was only half of the story:
Pre-All-Star: 1.86 HR/9; 2.10 BB/9; 5.57 K/9
Post-All-Star: 0.84 HR/9; 1.26 BB/9; 6.27 K/9
I looked back at Lieber’s 2004 campaign with the Yankees and saw that this was basically the same story: while Lieber’s walks and home runs allowed went up slightly, Lieber lowered his ERA from 4.77 to 3.94 and increased his strikeouts from 4.12 to 6.15 per nine innings.
I think this August and September you’ll see the same sort of improvement. Lieber has struggled at points this season. His FIP ERA is better than his regular ERA (4.43, compared to 5.10), but he’s struggled for big spots in the year. His April ERA, for example, was 7.04. Ouch. His August has been impressive, however, allowing just two home runs and walks in just twenty-four innings of work, with a 1.13 ERA and 17 K’s.
So there you go. The Phillies have a much better staff than you think and it seems to me that the Phillies pitchers could play a major – positive – role in the Phillies run to the playoffs. With Hamels and Lieber the Phillies have an impressive one-two punch that is very different: Hamels blazing fastballs and Lieber’s maddeningly slow sinkers. If the Phillies pitch Hamels and Lieber back-to-back, they could really throw a lot of teams out of whack. Add in Randy Wolf, the cagey veteran and Brett Myers, and the Phillies could have the makings of a powerful rotation. And if Ryan Madson settles down as the Phillies fireman of the ‘pen, the Phillies could have a difficult bullpen for a team to wade through: Tom Gordon, Madson, Geoff Geary, Arthur Rhodes. I’m optimistic.
A little aside … I was working on The Hardball Times site and I noticed that the Mets are running ahead of their Pythagorean win-loss record by four games, while the Phillies lag by two. If you look at the Pythagorean win-loss records, the race in the NL East is much closer than you think:
Pythagorean Win-Loss:
New York: 70-52
Philadelphia: 62-60 (8)
Atlanta: 62-60 (8)
Florida: 59-63 (11)
Washington: 54-69(15.5)
The thing is that the Phillies are 26-33 in games decided by two or fewer runs, while the Mets are 35-21. The Mets, in other words, have been a little lucky in 2006 and they’ve probably won’t keep it up. To be sure, the Mets have the better record even if you go by the Pythagorean records, but the gap between they and the Phillies is really smaller than you think: the Mets have a +91 in runs scored / runs allowed, while the Phillies are +16. What is significant is that the Phillies have scored more runs than they’ve allowed and they have a losing record: the Phillies have been unlucky this season. And beware of the Braves down the stretch. Their run differential is +14 and they have lost far more games than the Phils. While the Phillies are running two games behind their record, the Braves are four behind, suggesting to me that the Braves are poised to break out of their bad luck cycle and make a run. Stay Tuned.
Up this week for the Phils: On the road in Chicago to play the Cubbies. Four game set, followed by a return to New York to play the Mets.
(4) comments
Everyone hates the Phillies pitching. Pat Gillick busted on the Phillies pitching at the start of the season, and every pundit loves to assail the Phillies pitchers. This is a team that is built for offense and plays in a park that optimizes offense, everyone assumes. Since the Phillies moved from the Vet to Citizens Bank Ballpark they’ve been one of the worst pitching teams in the majors. Despite having real talent in the rotation over the last few campaigns, with players like Kevin Millwood and Vicente Padilla, the Phillies have been abysmal on the mound.
I think the problem in perception began when the Phillies brought Eric Milton on board as their ace for the 2004 season. Milton got off to a great start on paper, going 11-2 prior to the All-Star break and garnering indignant outrage when the Marlins Jack McKeon (correctly) elected to keep him off the All-Star team.
Milton was a nightmare. Milton was the winner of far too many 8-6 slugfests where the Phillies triumphed despite him, not because of him. Milton surrendered 1.83 home runs every nine innings before the break and 2.02 every nine innings after. His ERA at the break was a catastrophic 4.72. Milton’s problem was that he was a flyball pitcher who would have survived well at Yankees Stadium or Turner Field, but was poison at Citizens. (Although, I should note that Milton surrendered more home runs on the road than at home.) Milton was run out of town at the end of the season, as the Phillies tried to adapt to Citizens by switching to a staff manned with groundball pitchers. But the perception that Citizens was a pitcher-killer the same way Coors Field in Denver is has persisted. Call it The Curse of Eric Milton.
So the conventional wisdom is that the Phillies have a lousy pitching staff. True? Yes and no. Certainly the 2006 campaign has been rough on the Phillies. They’ve been inconsistent for the year:
ERA / WHIP
April: 5.03 / 1.56
May: 3.85 / 1.34
June: 5.80 / 1.64
July: 5.00 / 1.43
August: 3.71 / 1.18
Season: 4.74
They actually did halfway well for May and August and were atrocious in April, June and July:
By Month: ERA rank / Team Winning PercentageApril: 14th / (.417)
May: 5th / (.607)
June: 14th / (.333)
July: 10th / (.520)
August: 6th / (.625)
Season: 13th (.492)
Confused about what I’m talking about? Here are the stats I refer to defined:
WHIP – Walks plus hits by innings pitched: (BB + H) / IP = WHIP
ERA – Earned Run Average: (Earned Runs * 9) / IP = ERA
FIP – Fielding Independent Pitching: (13*HR+3*BB-2*K / IP) + League Factor Evaluates a pitching by how he would have done with an average defense behind him by keeping track of things that a pitcher can control (walks, strikeouts, home runs allowed) as opposed to things he cannot (hits allowed, runs allowed).
DER – Defense Efficiency Ratio: (Batters Faced – (Hits + Walks + Hit By Pitch + Strikeouts)) / (Batters Faced – (Home Runs, Walks + Hit By Pitch + Strikeouts)) How often fielders convert balls put into play into outs.
Hr/9 – Home Runs allowed per nine innings: (HR * 9) / IP
K/9 – Strikeouts per nine innings: (K * 9) / IP
BB/9 – Walks per nine innings: (BB * 9) / IP
The month of August, thus far, suggests that the Phillies pitching staff is on an upswing. I have a couple of reasons why:
1. The addition of Cole Hamels.
2. The subtraction of Gavin Floyd and Ryan Madson from the rotation.
3. The return of Randy Wolf
4. Brett Myers and Jon Lieber’s second wind.
I’ve resisted the temptation of engaging in Cole Hamels hype for a long time, but now I feel tempted to begin every column with “Isn’t Cole Hamels awesome? …”
Cole Hamels is a revelation and if he isn’t in the running for NL Rookie of the Year at the end of the season, I will formally demand a recount. Cole has done a great job thus far this season. Scope out some of the numbers:
FIP ERA K/9 BB/9 HR/9
Hamels: 3.86 10.5 3.5 1.2
Phillies: 4.63 6.8 3.3 1.3
National League: 4.51 6.6 3.4 1.1
Cole has been phenomenal with keeping the ball in the park, striking the opposition out and limiting their ability to put the ball into play. I feel like a prattal enough about Hamels, so I’ll move on after I note the improvement in Hamel’s ERA of late:
May: 3.18*
June: 6.49
July: 6.04
August: 0.86
* in just two starts.
 All of that suggests to me that Hamels is really starting to come into his own and be the terrific pitcher that most suspected he would be all along.
The subtraction of Gavin Floyd and Ryan Madson from the Phillies pitching staff (or in the case of Madson, his relegation to the bullpen) has been a major boon. Simply put, Gavin Floyd was unprepared mentally to pitch for the Phillies in 2006 and they ought to have known. He did terrible, hurling a 7.29 ERA (6.95 FIP ERA), allowing an Eric Milton-like two home runs every nine innings, and generally killing the Phillies every time he pitched. Ryan Madson did no better: 5.64 ERA (5.12 FIP), 1.4 Home Runs per nine innings. To be fair, Madson seems to be the victim of sloppy defense (.653 DER behind him), although part of that might be his fault (he’s allowing 22.2% of the balls put in play against him to be line-drives).
Gavin Floyd hasn’t pitched for the Phillies since June, and Ryan Madson was permanently moved into the bullpen in August after two efforts to make him a starter failed. Madson pitched well in August, entering seven games in relief, throwing 11& 1/3 innings, allowing just a 2.45 ERA, and two walks while striking out thirteen batters. I think this is a role he is ideally suited for and has had success at. If he accepts the move to the ‘pen, then I think he’ll find success. He needs to think of himself as a latter-day Jim Konstanty, the Phillies pitcher who won the 1950 NL MVP awards largely due to his clutch pitching, where he went 16-7 in a relief role, finishing over sixty games for the Phillies, often preserving fragile leads during the Phillies run to the pennant in 1950.
Randy is back. After injuring his arm in 2005, I never expected to see Randy Wolf back with the Phillies. I figured that the team would cut him loose, but I am happy to see that didn’t happen. Wolf has been hurling alright. His ERA is a decent 4.35, but that masks a much higher 5.84 FIP ERA. What gives me confidence that Wolf will pitch well is that he seems determined to show that he’s capable of contributing to the Phillies and his arm is fresh and ready to go. Another promising sign of the season is that Wolf is allowing just 16.1% of the balls put into play against him to be line-drives, a pretty low percent that is probably a factor in the Phillies impressive .746 DER behind him.
I don’t really care for Brett Myers the person, given what I read about the incident where he beat his wife in the street in Boston (particularly damaging to me was the quote from the 911 call where Kim Myers allegedly wailed that she wouldn’t allow him to beat her anymore, suggesting that this wasn’t a one-time incident and that Brett has serious anger management issues). Brett Myers the baseball player might be ready to make a big impact for the Phillies down the stretch, although his horrible August suggests otherwise. He is a terrific pitcher, the Phillies 2005 ace, and he could really help the team down the stretch if his mind is right. He's had a decent season thus far, given all that has transpired:
Myers: 4.21 FIP ERA, 17.7% Line-Drives, 8.3 K/9, 2.9 BB/9, 1.4 HR/9
I can’t say that I’m rooting for him (not being a big fan of big guys who pummel their little wives and all), but I hope that he contributes to the team.
I’ve long defended Jon Lieber and, to a lesser extent, the now departed Cory Lidle, as being pitchers who don’t get their due. Solid, unspectacular sinkerball pitchers, they get the job done without the flashy strikeouts. So I’m ready to make a bold prediction: Jon Lieber is going to have a phenomenal August and September for the Phillies.
I was very disappointed to watch Jon Lieber struggle when he joined the Phillies for the 2005 season. Prior to the All-Star break Lieber seemed to get pummeled, surrendering far too many home runs, allowing far too many walks and generally allowing the opposition to do what he was hired not to do: give up home runs and walks. When the Phillies signed Lieber in ’05, I was excited to see Lieber pitch because of what he did with the Yankees in 2004: 18 walks allowed and 20 home runs allowed in 176 & 2/3 innings pitched. The Home Runs allowed isn’t bad, that is basically a home run allowed every nine innings (1.02 HR/9). In terms of walks, that is astonishing. He allowed just 0.92 walks per nine
 innings. Lieber could go two or three starts without allowing a walk. Lieber would do well, I was certain, because of that ability to keep the ball in the park and keep runners off the base-paths. It didn’t work out that way in 2005. Lieber’s walks spiked to 1.69 BB/9, and his home runs went to 1.36 HR/9. But if you looked closely, you could see that this was only half of the story:
Pre-All-Star: 1.86 HR/9; 2.10 BB/9; 5.57 K/9
Post-All-Star: 0.84 HR/9; 1.26 BB/9; 6.27 K/9
I looked back at Lieber’s 2004 campaign with the Yankees and saw that this was basically the same story: while Lieber’s walks and home runs allowed went up slightly, Lieber lowered his ERA from 4.77 to 3.94 and increased his strikeouts from 4.12 to 6.15 per nine innings.
I think this August and September you’ll see the same sort of improvement. Lieber has struggled at points this season. His FIP ERA is better than his regular ERA (4.43, compared to 5.10), but he’s struggled for big spots in the year. His April ERA, for example, was 7.04. Ouch. His August has been impressive, however, allowing just two home runs and walks in just twenty-four innings of work, with a 1.13 ERA and 17 K’s.
So there you go. The Phillies have a much better staff than you think and it seems to me that the Phillies pitchers could play a major – positive – role in the Phillies run to the playoffs. With Hamels and Lieber the Phillies have an impressive one-two punch that is very different: Hamels blazing fastballs and Lieber’s maddeningly slow sinkers. If the Phillies pitch Hamels and Lieber back-to-back, they could really throw a lot of teams out of whack. Add in Randy Wolf, the cagey veteran and Brett Myers, and the Phillies could have the makings of a powerful rotation. And if Ryan Madson settles down as the Phillies fireman of the ‘pen, the Phillies could have a difficult bullpen for a team to wade through: Tom Gordon, Madson, Geoff Geary, Arthur Rhodes. I’m optimistic.
A little aside … I was working on The Hardball Times site and I noticed that the Mets are running ahead of their Pythagorean win-loss record by four games, while the Phillies lag by two. If you look at the Pythagorean win-loss records, the race in the NL East is much closer than you think:
Pythagorean Win-Loss:
New York: 70-52
Philadelphia: 62-60 (8)
Atlanta: 62-60 (8)
Florida: 59-63 (11)
Washington: 54-69(15.5)
The thing is that the Phillies are 26-33 in games decided by two or fewer runs, while the Mets are 35-21. The Mets, in other words, have been a little lucky in 2006 and they’ve probably won’t keep it up. To be sure, the Mets have the better record even if you go by the Pythagorean records, but the gap between they and the Phillies is really smaller than you think: the Mets have a +91 in runs scored / runs allowed, while the Phillies are +16. What is significant is that the Phillies have scored more runs than they’ve allowed and they have a losing record: the Phillies have been unlucky this season. And beware of the Braves down the stretch. Their run differential is +14 and they have lost far more games than the Phils. While the Phillies are running two games behind their record, the Braves are four behind, suggesting to me that the Braves are poised to break out of their bad luck cycle and make a run. Stay Tuned.
Up this week for the Phils: On the road in Chicago to play the Cubbies. Four game set, followed by a return to New York to play the Mets.
![]()


