Friday, October 27, 2006
The Wiz Kids, Part VIII: Focus on the Opposition … the also-rans.
I’ve complained often that the media is obsessed with the City of New York. How many TV shows are set in New York City? Everything that happens in New York is news because the national media is headquartered there and thinks that the world begins and ends at the edge of Manhattan Island. History’s obsession with New York baseball reached its nadir in the 1950s when the Dodgers, Giants and Yankees had their way with the rest of the major leagues and culminated with a dramatic series of events: Bobby Thomson’s home run in 1951, the Dodgers winning the 1955 World Series, Don Larsen’s perfect game in 1956, and the decision by the Giants and Dodgers to leave New York for California in 1957. So the obsession the media has with New York baseball in the 1950s is understandable, but very frustrating. Of the sixteen major league teams, thirteen played outside of the confines of New York City.
Well, the Dodgers and Giants weren’t the only teams competing with the Phillies for the National League pennant. To varying degrees the Boston Braves and St. Louis Cardinals were also in the thick of things in the NL pennant race, while fans in Cincinnati, Pittsburgh and Chicago dreamed of better days ahead. Let’s look at them, starting with the Braves.
The Boston Braves. I realized something about the 1950 Boston Braves as I examined their stats. This team had a very good pitching staff. Very good. Jim Konstanty may have won the 1950 MVP award, and Robin Roberts may generally be recognized for being the best pitcher in the NL in 1950, but there is an argument to be made that Warren Spahn was the best pitcher in the NL in 1950. Look at FIP ERAs*:
Jim Konstanty: 3.70
Robin Roberts: 3.55
Curt Simmons: 3.53
Warren Spahn: 3.32
* FIP – Fielding Independent Pitching: (13*HR+3*BB-2*K / IP) + League Factor Evaluates a pitching by how he would have done with an average defense behind him by keeping track of things that a pitcher can control (walks, strikeouts, home runs allowed) as opposed to things he cannot (hits allowed, runs allowed).
This was an extraordinarily talented team that boasted a tremendous threesome of Spahn, Johnny Sain and Vern Bickford. Spahn, Sain and Bickford threw 883 of the Braves 1,385 innings (64%) that season. Aside from Roberts 304 and a third innings, nobody threw more innings then Bickford (311 & 2/3), Spahn (293) and Sain (278 & 1/3) in the NL. They went 60-44 and threw 77 complete games. They were an extraordinary trio, but they were all the team had. Their collective ERA was 3.52. The rest of the team was 5.24 …
The Braves also had a good offense, finishing second in the NL in runs scored with 785, 63 more than the Phillies. The Braves were third in the NL in Isolated Power at .142, compared to the Phils .134, and second in Gross Productive Average (GPA) at .253, as compared to the Phillies .248 … The Braves had a very efficient offensive unit. Their 785 runs dramatically out-performs their Base Runs (734), their Batting Runs (746) and their Runs Created (761).
Confused about what I’m talking about? Here are the stats I refer to defined:
Gross Productive Average (GPA): (1.8 * .OBP + .SLG) / 4 = .GPA. Invented by The Hardball Times Aaron Gleeman, GPA measures a players production by weighing his ability to get on base and hit with power. This is my preferred all-around stat.
Isolated Power (ISO): .SLG - .BA = .ISO. Measures a player’s raw power by subtracting singles from their slugging percentage.
On-Base Percentage (OBP): How often a player gets on base. (H + BB + HBP) / (Plate Appearances)
Walks per plate appearance (BB/PA): BB / PA = .BB/PA Avg
Slugging Percentage (SLG): Total Bases / At-Bats = Slugging Percentage. Power at the plate.
Runs Created (RC): A stat originally created by Bill James to measure a player’s total contribution to his team’s lineup. The formula I use for this article is taken from Bill James Historical Abstract circa 1988, when he developed special formulas for Runs Created based on stats that the MLB kept (e.g., caught stealing wasn't a stat baseball kept track of until 1951). The formula is: [(H + BB + HBP - GIDP) times (Total Bases + .26 * (BB + HBP) + .52 * SH)] divided by (AB + BB + HBP + SH).
RC/27: Runs Created per 27 outs, essentially what a team of 9 of this player would score in a hypothetical game.
Base Runs: Developed by Dave Smyth as an alternative to Runs Created. Here is the formula: (A: H + BB + HBP – HR ; B: (.8 * 1B) + (2.1 * 2B) + (3.4 * 3B) + (1.8 * HR) + (.1*(BB + HBP)); C: AB – H; D: HR) Then simply divide B into B + C, then multiply A to the result and add D.
Batting Runs: Another alternative to Runs Created, developed by Pete Palmer as part of his linear weights system. The formula: (.47 * H) + (.38 * D) + (.55 * T) + (.93 * HR) + (.33 * (BB + HBP)) + (.22 * SB) + (-.38 * CS) + (-.10 * (AB - H)).
The key to the Braves offense was balance. They had five players who hit fourteen or more home runs. The team did not merely rely on Earl Torgeson (123 Runs Created, 7.81 Runs Created per 27 Outs, 114 Base Runs), Sid Gordon (107 Runs Created, 8.27 Runs Created per 27 Outs, 103 Base Runs) and Bob Elliott (103 Runs Created, 7.19 Runs Created per 27 Outs, 99 Base Runs), they also had NL Rookie of the Year Sam Jethroe, who led the NL in stolen bases with thirty-five (twice as many as the Dodgers Pee Wee Reese). The Braves were the second-best offensive team in the NL after the Dodgers. Unfortunately, it wasn’t enough.
On May 6 the Braves were in first place with a 10-7 record, and they would steadily hang in the playoff picture for another two months. At the All-Star break the Braves were 42-31, two games behind the Phillies. After defeating the Chicago Cubs 10-2 on August 4 behind Warrn Spahn, the Braves were three games out of first and very much in the thick of the playoff hunt. The Braves then lost ten of their next fourteen games and tumbled to eight games out. The Braves would battle back to try and keep pace with the Phillies, but it was too much. On September 17, 1950, they managed to jump into second place, a half game ahead of the Dodgers and seven and a half behind the Phillies, but the Braves would go 5-11 the rest of the way, while the Dodgers made a 13-5 dash to catch up to the Phillies. I suspect that if you go back and examine the Braves season, you’ll find that the strain of pitching every third day wore Spahn, Bickford and Sain down.
The Braves would leave the Boston area after the 1952 season and journey westward to Milwaukee, where they immediately became the prime challenger to the Dodgers – Giants duopoly, finishing second to the Dodgers in 1953, 1955 and 1956 before breaking through to win the 1957 World Series over the Yankees and grab the ’58 pennant as well. The Braves deserted Milwaukee in 1965 and journeyed to the South to Atlanta, where they became baseball’s sole team inside of the Old Confederacy (excluding Texas) until the Florida Marlins were created in 1993. Until the team’s modern era (since 1990), the Atlanta Braves were an also-ran for nearly three decades.
The St. Louis Cardinals. Back in the 1950s, the St. Louis Cardinals were the extreme western limit of major league baseball. It was simply too far for teams to travel in trains to go that much further west of the Mississippi River. Air travel, which became widely available during the ‘50s, enabled baseball to move west and embrace California and the Mountain West. However until the A’s abandoned Philadelphia for Kansas City in 1955, the Cardinals were baseball’s western team and the southern team as well.
The Cardinals had a lot of proud history going into the 1950 season. They had most recently won the World Series in 1946, defeating the Boston Red Sox in seven games. Prior to 1946, they had captured the NL pennant in 1942, 1943 and 1944, winning the series in ’42 over the Yankees and in ’44 over the cross-town Browns (who would later move to Baltimore and go on to become the Orioles). Even before that the Cardinals had the Gashouse Gang, a goofy collection of players who had captured the NL pennant five times in nine years between 1926 and 1934 and won three World Series.
The 1950 Cardinals would be less fortunate than their 1920s, 1930s and 1940s counterparts. The ‘50’s weren’t a good time for the Cards. 1946 would turn out to be Stan Musial’s last championship. The Cards wouldn’t capture the NL pennant again until 1964, when the Phillies aided their path to the World Series by collapsing at the end of the season.
Jim Konstanty won the 1950 MVP award and was unquestionably vital to the Phillies in their battle for the post-season, however, I think the best individual player in the league in 1950 was the Cardinals Musial. The twenty-time All-Star had won the MVP award in 1943, 1946 and 1948, and finished second to Konstanty in 1950. Musial would be the NL runner-up from 1949 to 1951.
Musial was a phenomenal player. He may not have had the most explosive bat in the league, but he was consistently the most dangerous hitter.
NL Runs Created (1950):
1. Musial (Cards): 149
2. Snider (Dodgers): 133
3. Kiner (Pirates): 130
4. Torgeson (Braves): 123
5. Stanky (Giants): 121
6. Pafko (Cubs): 121
Musial produced 10.75 runs created per 27 outs, tops in the league. That only gives you a brief glimpse at how tough an out Musial was.
Unfortunately for Musial, the Cardinals didn’t have a whole lot else going for them. The rest of the team had aged and atrophied over the three years since the Cards won the World Series. The Cardinals had a decent pitching staff, which finished second to the Phillies in the league in Fielding Independent Pitching (FIP), and home runs allowed (0.79 per nine innings, as well as third in league in walks allowed (3.55 per nine innings), and strikeouts (4.00 per nine innings). The Cards didn’t have a lot of pop at the plate after Musial and they didn’t play defense well. As late in the season as July 20, after sweeping both ends of a double-header with 18-4 and 10-3 victories, the Cardinals owned sole possession of first place in the NL. After that, the Cardinals would drop 41 of their remaining 71 games and struggle to remain at .500. The season would end with the Cardinals in fifth place.
The Cincinnati Reds. There wasn’t a whole lot positive for Reds fans in 1950. The team finished sixth, a position it would occupy for the next three seasons as well. The Phillies largely had their way with the Reds in 1950, winning eighteen of their twenty-two games against them, easily the Phillies best performance against any other team in the National League that season.
The Reds did little right in 1950. They finished dead-last in the NL in Isolated Power (ISO) at .116, well under the league average of .140 and the Phillies .131 … The Reds Gross Productive Average (GPA) was nearly the worst as well, at .240, as compared with the NL average of .250 and the Phillies .248. The Reds were last in the NL in BaseRuns with 631, last in the NL in Batting Runs with 638, and last in the NL in Runs Created with 652. They were the second-worst scoring offense in the NL.
Their pitching wasn’t much better, finishing seventh in the NL in ERA, fifth in FIP ERA, seventh in walks allowed (3.86 per nine innings) and sixth in home runs allowed (0.96 per nine innings). The only areas where the Reds excelled at were defense, where the Reds had the third-best DER in the NL – .708 – after the Phillies (.719) and Giants (.729), and strikeouts, where the Reds pitching staff K’d 4.55 batters per nine innings, a terrific number only exceeded by the Dodgers (5.00).
A disastrous May (6-19) saw the Reds occupy the cellar for most of the season. After losing to the Dodgers 8-2 on June 20, the Reds were in dead-last, 15-38 (.283), a whopping eighteen games behind the Dodgers and seventeen behind the Phillies and Cardinals just fifty-three games into the season. The Reds went on to win as many games as they lost the rest of the way (51-49), but the damage was done. A ten-game losing streak from August 18 to August 27 ended any chance the Reds had of a winning season. They limped to a sixth place finish. Their 28-49 record at home (.364, versus 38-38, .500 on the road) kept fans away in droves. The Reds drew 538,794 fans in 1950, nearly 405,597 fewer fans than the Braves, the next-worst team in terms of attendance. The Pirates and Cubs, despite finishing worse than the Reds, attracted well over twice as many fans to their ballparks.
The Pittsburgh Pirates. The 1950 Pirates were an interesting enigma, though they were the worst team in the NL, a distinction they would possess or share until 1958, when they finished in second place and get ready to play in the 1960 World Series. The Pirates would finish seventh or eighth every year from 1950 to 1957, despite having future Hall of Famer Ralph Kiner in the lineup.
Kiner was a remarkable player: just 27 entering the 1950 season, he had hit 54 home runs in 1949 and entered the 1950 season having hit 168 home runs already in his brief career. He hit another 47 in 1950 and drove in 118 runs. Kiner may have been the best hitter in the NL in 1950 (though I think that distinction belongs to Stan Musial), and his presence in the lineup helped the Pirates finish second in Isolated Power and Slugging Percentage and third in Gross Productive Average in the NL. And yet the Pirates were sixth in runs scored. On paper they should have been a pretty decent team at the plate, but no team had a bigger variance between its Runs Created and Actual Runs:
Runs Created / Actual Runs
Reds: 652 / 681 (+29)
Braves: 761 / 785 (+24)
Cubs: 643 / 658 (+15)
Dodgers: 841 / 847 (+6)
Giants: 738 / 735 (-3)
Phillies: 725 / 722 (-3)
Cardinals: 701 / 693 (-8)
Pirates: 737 / 681 (-56)
The Pirates problem simply was that Kiner was their only real threat. Note that 40% of Kiner’s RBIs were of himself: home runs. Kiner drove in just 71 teammates. Compare that to Duke Snider, whose home runs amount to just 30% of his RBIs, or Del Ennis, whose homers were 25% of his RBIs. Kiner had 130 Runs Created in 1950, 18% of the team’s output. Bill James noted that the ’50 Pirates were the most inefficient team of the 1950s in his 2005 Handbook (Page 15), losing fourteen more games than they should have. It was an offensively inefficient team and you have to wonder how frustrated Kiner was playing on the Pirates.
Defensively the Pirates were pretty ordinary. In terms of pitching the Pirates were the worst in the NL: dead-last in terms of ERA (in fact over a half run worse than the next-worst team, the Cincinnati Reds) and dead-last in terms of FIP (a quarter of a run worse than the Cubs). No team got fewer strikeouts (3.66 per nine innings), surrendered more walks (4.05 per nine innings), and only the Dodgers gave up more home runs (1.00 per nine innings).
Interestingly, despite being the worst team in the National League and never really being a factor in the race for the pennant (even as early as June 1, 1950, the Pirates were eight games out of first), the Pirates were third in the NL in attendance, after the Phillies and Dodgers. In fact the Pirates drew just 19,629 fewer people than the Dodgers and 50,768 fewer than the Phillies. The Pirates drew more than twice as many fans as their rivals down the Ohio River, the Cincinnati Reds. Despite being a bad team, they were popular.
The Chicago Cubs. I’ve always thought that the Chicago Cubs are a very strange franchise. Whereas the suffering of the Boston Red Sox inspired Shakespearean pathos thanks to the multitudes of writers who live in or hail from New England, the Cubs have a sort of bland Midwestern happiness to their futility. The Red Sox may have been cursed to fail as spectacularly as they have, but the Cubs are the victims of simple incompetence.
The 1950 Cubs were nothing special, and have no indication to their fans that they had played in the 1945 World Series and nearly won. Their offense was almost entirely dependant on home runs to generate runs. The 1950 Cubs hit 161 home runs, second in the league to the Dodgers 194. The Cubs were also second in Isolated Power at .153, .013 better than the league average and .022 better than the Phillies. Despite this strength at the plate, the Cubs were a terrible offensive team. They were dead-last in the NL in runs scored at 643. They had, by far, the lowest On-Base Percentage in the NL (.311), drew the fewest walks, and the lowest Gross Productive Average (GPA) in the game: .240 … The Cubs 643 runs scored under-performs their Base Runs (650), Batting Runs (656) and Runs Created (658). After home runs the only stat they led the league in was strikeouts.
Andy Pafko had an exceptional season with 121 Runs Created (8.88 Runs Created per 27 Outs) for the Cubs, as did 1952 MVP Hank Sauer (96 Runs Created, 6.39 Runs Created per 27 Outs), but the Cubs were too inconsistent at the plate to be the equal of the Dodgers.
If the Cubs offense was forgettable, than their pitching and defense were more so. Led by Bob Rush, who lost twenty games in 1950, the Cubs finished seventh in Fielding Independent Pitching (FIP), seventh in strikeouts, sixth in walks allowed, and sixth in ERA. Their lousy pitching was further undermined by a terrible defense. Defensively, the Cubs were the worst team in the NL, with a .694 DER, .007 worse than the Braves and Pirates and .035 worse than the Giants. The Cubs led the NL in errors with 198, 47 more than the Phillies, 61 more than the Giants and 71 more than the Dodgers. This was not a good defensive team. In fact, they allowed a whopping 120 un-earned runs! (.78 UERA)
The Cubs were never really in the playoff picture. After starting the season 3-0, they steadily dropped back in the standings. At the All-Star break the Cubs were 33-38 and ten games behind the Phillies. Their record would just get worse. The Cubs posted the worst post-All Star game record in the NL, going 31-51. On July 21 the Cubs swept a two-game series with the Braves and improved to 39-41, just seven games out of first place. They would lose seventeen of their next twenty-one games. After losing to the Pirates 7-4 on August 10, the Cubs were nineteen and a half games out of first and their season was finished. The Cubs would go 10-19 in September, finishing in seventh place, seven games ahead of the Pirates. The Cubs record since hasn’t been the best.
This season the Cubs are fast-approaching their centennial since their last World Series victory in 1908. Since then, the Cubs lost seven World Series all between 1910 and 1945. After the Cubs lost Game Seven of the 1945 World Series to the Detroit Tigers on October 10, 1945, they wouldn’t make the playoffs for another thirty-nine years! When they finally did in 1984, the Cubs proceeded to lose the NLCS to the San Diego Padres 3-2 despite winning the first two games 13-0 and 4-2. The Cubs have made the playoffs just three times since, losing the 1989 NLCS to the San Francisco Giants 4-1, losing the NLDS to the Braves 3-0 in 1998, and then, humiliatingly, losing the 2003 NLCS to the Marlins after leading the series 3-1 and being just five outs away from victory in Game Six before surrendering eight runs to lose 8-3. The Red Sox were able to pull themselves together after their collapse against the Yankees in Game 7 of the ALCS and win the 2004 World Series, but the Cubs continue to be the loveable losers of Wrigley Field.
Those were the also-rans.
Next, I’ll talk about what happened to the Phillies after the All-Star Break on Tuesday after I get done giving some thoughts on the World Series on Monday.
Previous Installments of the Wiz Kids:
Part VII: The Giants & Dodgers.
Part VI: Curt Simmons.
Part V: Robin Roberts.
Part IV: The first half of the 1950 season.
Part III: Jim Konstanty.
Part II: Eddie Sawyer.
Part I: The Path to 1950.
Prolouge.
(1) comments
Well, the Dodgers and Giants weren’t the only teams competing with the Phillies for the National League pennant. To varying degrees the Boston Braves and St. Louis Cardinals were also in the thick of things in the NL pennant race, while fans in Cincinnati, Pittsburgh and Chicago dreamed of better days ahead. Let’s look at them, starting with the Braves.
The Boston Braves. I realized something about the 1950 Boston Braves as I examined their stats. This team had a very good pitching staff. Very good. Jim Konstanty may have won the 1950 MVP award, and Robin Roberts may generally be recognized for being the best pitcher in the NL in 1950, but there is an argument to be made that Warren Spahn was the best pitcher in the NL in 1950. Look at FIP ERAs*:
Jim Konstanty: 3.70
Robin Roberts: 3.55
Curt Simmons: 3.53
Warren Spahn: 3.32
* FIP – Fielding Independent Pitching: (13*HR+3*BB-2*K / IP) + League Factor Evaluates a pitching by how he would have done with an average defense behind him by keeping track of things that a pitcher can control (walks, strikeouts, home runs allowed) as opposed to things he cannot (hits allowed, runs allowed).
This was an extraordinarily talented team that boasted a tremendous threesome of Spahn, Johnny Sain and Vern Bickford. Spahn, Sain and Bickford threw 883 of the Braves 1,385 innings (64%) that season. Aside from Roberts 304 and a third innings, nobody threw more innings then Bickford (311 & 2/3), Spahn (293) and Sain (278 & 1/3) in the NL. They went 60-44 and threw 77 complete games. They were an extraordinary trio, but they were all the team had. Their collective ERA was 3.52. The rest of the team was 5.24 …
The Braves also had a good offense, finishing second in the NL in runs scored with 785, 63 more than the Phillies. The Braves were third in the NL in Isolated Power at .142, compared to the Phils .134, and second in Gross Productive Average (GPA) at .253, as compared to the Phillies .248 … The Braves had a very efficient offensive unit. Their 785 runs dramatically out-performs their Base Runs (734), their Batting Runs (746) and their Runs Created (761).
Confused about what I’m talking about? Here are the stats I refer to defined:
Gross Productive Average (GPA): (1.8 * .OBP + .SLG) / 4 = .GPA. Invented by The Hardball Times Aaron Gleeman, GPA measures a players production by weighing his ability to get on base and hit with power. This is my preferred all-around stat.
Isolated Power (ISO): .SLG - .BA = .ISO. Measures a player’s raw power by subtracting singles from their slugging percentage.
On-Base Percentage (OBP): How often a player gets on base. (H + BB + HBP) / (Plate Appearances)
Walks per plate appearance (BB/PA): BB / PA = .BB/PA Avg
Slugging Percentage (SLG): Total Bases / At-Bats = Slugging Percentage. Power at the plate.
Runs Created (RC): A stat originally created by Bill James to measure a player’s total contribution to his team’s lineup. The formula I use for this article is taken from Bill James Historical Abstract circa 1988, when he developed special formulas for Runs Created based on stats that the MLB kept (e.g., caught stealing wasn't a stat baseball kept track of until 1951). The formula is: [(H + BB + HBP - GIDP) times (Total Bases + .26 * (BB + HBP) + .52 * SH)] divided by (AB + BB + HBP + SH).
RC/27: Runs Created per 27 outs, essentially what a team of 9 of this player would score in a hypothetical game.
Base Runs: Developed by Dave Smyth as an alternative to Runs Created. Here is the formula: (A: H + BB + HBP – HR ; B: (.8 * 1B) + (2.1 * 2B) + (3.4 * 3B) + (1.8 * HR) + (.1*(BB + HBP)); C: AB – H; D: HR) Then simply divide B into B + C, then multiply A to the result and add D.
Batting Runs: Another alternative to Runs Created, developed by Pete Palmer as part of his linear weights system. The formula: (.47 * H) + (.38 * D) + (.55 * T) + (.93 * HR) + (.33 * (BB + HBP)) + (.22 * SB) + (-.38 * CS) + (-.10 * (AB - H)).
The key to the Braves offense was balance. They had five players who hit fourteen or more home runs. The team did not merely rely on Earl Torgeson (123 Runs Created, 7.81 Runs Created per 27 Outs, 114 Base Runs), Sid Gordon (107 Runs Created, 8.27 Runs Created per 27 Outs, 103 Base Runs) and Bob Elliott (103 Runs Created, 7.19 Runs Created per 27 Outs, 99 Base Runs), they also had NL Rookie of the Year Sam Jethroe, who led the NL in stolen bases with thirty-five (twice as many as the Dodgers Pee Wee Reese). The Braves were the second-best offensive team in the NL after the Dodgers. Unfortunately, it wasn’t enough.
On May 6 the Braves were in first place with a 10-7 record, and they would steadily hang in the playoff picture for another two months. At the All-Star break the Braves were 42-31, two games behind the Phillies. After defeating the Chicago Cubs 10-2 on August 4 behind Warrn Spahn, the Braves were three games out of first and very much in the thick of the playoff hunt. The Braves then lost ten of their next fourteen games and tumbled to eight games out. The Braves would battle back to try and keep pace with the Phillies, but it was too much. On September 17, 1950, they managed to jump into second place, a half game ahead of the Dodgers and seven and a half behind the Phillies, but the Braves would go 5-11 the rest of the way, while the Dodgers made a 13-5 dash to catch up to the Phillies. I suspect that if you go back and examine the Braves season, you’ll find that the strain of pitching every third day wore Spahn, Bickford and Sain down.
The Braves would leave the Boston area after the 1952 season and journey westward to Milwaukee, where they immediately became the prime challenger to the Dodgers – Giants duopoly, finishing second to the Dodgers in 1953, 1955 and 1956 before breaking through to win the 1957 World Series over the Yankees and grab the ’58 pennant as well. The Braves deserted Milwaukee in 1965 and journeyed to the South to Atlanta, where they became baseball’s sole team inside of the Old Confederacy (excluding Texas) until the Florida Marlins were created in 1993. Until the team’s modern era (since 1990), the Atlanta Braves were an also-ran for nearly three decades.
The St. Louis Cardinals. Back in the 1950s, the St. Louis Cardinals were the extreme western limit of major league baseball. It was simply too far for teams to travel in trains to go that much further west of the Mississippi River. Air travel, which became widely available during the ‘50s, enabled baseball to move west and embrace California and the Mountain West. However until the A’s abandoned Philadelphia for Kansas City in 1955, the Cardinals were baseball’s western team and the southern team as well.
The Cardinals had a lot of proud history going into the 1950 season. They had most recently won the World Series in 1946, defeating the Boston Red Sox in seven games. Prior to 1946, they had captured the NL pennant in 1942, 1943 and 1944, winning the series in ’42 over the Yankees and in ’44 over the cross-town Browns (who would later move to Baltimore and go on to become the Orioles). Even before that the Cardinals had the Gashouse Gang, a goofy collection of players who had captured the NL pennant five times in nine years between 1926 and 1934 and won three World Series.
The 1950 Cardinals would be less fortunate than their 1920s, 1930s and 1940s counterparts. The ‘50’s weren’t a good time for the Cards. 1946 would turn out to be Stan Musial’s last championship. The Cards wouldn’t capture the NL pennant again until 1964, when the Phillies aided their path to the World Series by collapsing at the end of the season.
Jim Konstanty won the 1950 MVP award and was unquestionably vital to the Phillies in their battle for the post-season, however, I think the best individual player in the league in 1950 was the Cardinals Musial. The twenty-time All-Star had won the MVP award in 1943, 1946 and 1948, and finished second to Konstanty in 1950. Musial would be the NL runner-up from 1949 to 1951.
Musial was a phenomenal player. He may not have had the most explosive bat in the league, but he was consistently the most dangerous hitter.
NL Runs Created (1950):
1. Musial (Cards): 149
2. Snider (Dodgers): 133
3. Kiner (Pirates): 130
4. Torgeson (Braves): 123
5. Stanky (Giants): 121
6. Pafko (Cubs): 121
Musial produced 10.75 runs created per 27 outs, tops in the league. That only gives you a brief glimpse at how tough an out Musial was.
Unfortunately for Musial, the Cardinals didn’t have a whole lot else going for them. The rest of the team had aged and atrophied over the three years since the Cards won the World Series. The Cardinals had a decent pitching staff, which finished second to the Phillies in the league in Fielding Independent Pitching (FIP), and home runs allowed (0.79 per nine innings, as well as third in league in walks allowed (3.55 per nine innings), and strikeouts (4.00 per nine innings). The Cards didn’t have a lot of pop at the plate after Musial and they didn’t play defense well. As late in the season as July 20, after sweeping both ends of a double-header with 18-4 and 10-3 victories, the Cardinals owned sole possession of first place in the NL. After that, the Cardinals would drop 41 of their remaining 71 games and struggle to remain at .500. The season would end with the Cardinals in fifth place.
The Cincinnati Reds. There wasn’t a whole lot positive for Reds fans in 1950. The team finished sixth, a position it would occupy for the next three seasons as well. The Phillies largely had their way with the Reds in 1950, winning eighteen of their twenty-two games against them, easily the Phillies best performance against any other team in the National League that season.
The Reds did little right in 1950. They finished dead-last in the NL in Isolated Power (ISO) at .116, well under the league average of .140 and the Phillies .131 … The Reds Gross Productive Average (GPA) was nearly the worst as well, at .240, as compared with the NL average of .250 and the Phillies .248. The Reds were last in the NL in BaseRuns with 631, last in the NL in Batting Runs with 638, and last in the NL in Runs Created with 652. They were the second-worst scoring offense in the NL.
Their pitching wasn’t much better, finishing seventh in the NL in ERA, fifth in FIP ERA, seventh in walks allowed (3.86 per nine innings) and sixth in home runs allowed (0.96 per nine innings). The only areas where the Reds excelled at were defense, where the Reds had the third-best DER in the NL – .708 – after the Phillies (.719) and Giants (.729), and strikeouts, where the Reds pitching staff K’d 4.55 batters per nine innings, a terrific number only exceeded by the Dodgers (5.00).
A disastrous May (6-19) saw the Reds occupy the cellar for most of the season. After losing to the Dodgers 8-2 on June 20, the Reds were in dead-last, 15-38 (.283), a whopping eighteen games behind the Dodgers and seventeen behind the Phillies and Cardinals just fifty-three games into the season. The Reds went on to win as many games as they lost the rest of the way (51-49), but the damage was done. A ten-game losing streak from August 18 to August 27 ended any chance the Reds had of a winning season. They limped to a sixth place finish. Their 28-49 record at home (.364, versus 38-38, .500 on the road) kept fans away in droves. The Reds drew 538,794 fans in 1950, nearly 405,597 fewer fans than the Braves, the next-worst team in terms of attendance. The Pirates and Cubs, despite finishing worse than the Reds, attracted well over twice as many fans to their ballparks.
The Pittsburgh Pirates. The 1950 Pirates were an interesting enigma, though they were the worst team in the NL, a distinction they would possess or share until 1958, when they finished in second place and get ready to play in the 1960 World Series. The Pirates would finish seventh or eighth every year from 1950 to 1957, despite having future Hall of Famer Ralph Kiner in the lineup.
Kiner was a remarkable player: just 27 entering the 1950 season, he had hit 54 home runs in 1949 and entered the 1950 season having hit 168 home runs already in his brief career. He hit another 47 in 1950 and drove in 118 runs. Kiner may have been the best hitter in the NL in 1950 (though I think that distinction belongs to Stan Musial), and his presence in the lineup helped the Pirates finish second in Isolated Power and Slugging Percentage and third in Gross Productive Average in the NL. And yet the Pirates were sixth in runs scored. On paper they should have been a pretty decent team at the plate, but no team had a bigger variance between its Runs Created and Actual Runs:
Runs Created / Actual Runs
Reds: 652 / 681 (+29)
Braves: 761 / 785 (+24)
Cubs: 643 / 658 (+15)
Dodgers: 841 / 847 (+6)
Giants: 738 / 735 (-3)
Phillies: 725 / 722 (-3)
Cardinals: 701 / 693 (-8)
Pirates: 737 / 681 (-56)
The Pirates problem simply was that Kiner was their only real threat. Note that 40% of Kiner’s RBIs were of himself: home runs. Kiner drove in just 71 teammates. Compare that to Duke Snider, whose home runs amount to just 30% of his RBIs, or Del Ennis, whose homers were 25% of his RBIs. Kiner had 130 Runs Created in 1950, 18% of the team’s output. Bill James noted that the ’50 Pirates were the most inefficient team of the 1950s in his 2005 Handbook (Page 15), losing fourteen more games than they should have. It was an offensively inefficient team and you have to wonder how frustrated Kiner was playing on the Pirates.
Defensively the Pirates were pretty ordinary. In terms of pitching the Pirates were the worst in the NL: dead-last in terms of ERA (in fact over a half run worse than the next-worst team, the Cincinnati Reds) and dead-last in terms of FIP (a quarter of a run worse than the Cubs). No team got fewer strikeouts (3.66 per nine innings), surrendered more walks (4.05 per nine innings), and only the Dodgers gave up more home runs (1.00 per nine innings).
Interestingly, despite being the worst team in the National League and never really being a factor in the race for the pennant (even as early as June 1, 1950, the Pirates were eight games out of first), the Pirates were third in the NL in attendance, after the Phillies and Dodgers. In fact the Pirates drew just 19,629 fewer people than the Dodgers and 50,768 fewer than the Phillies. The Pirates drew more than twice as many fans as their rivals down the Ohio River, the Cincinnati Reds. Despite being a bad team, they were popular.
The Chicago Cubs. I’ve always thought that the Chicago Cubs are a very strange franchise. Whereas the suffering of the Boston Red Sox inspired Shakespearean pathos thanks to the multitudes of writers who live in or hail from New England, the Cubs have a sort of bland Midwestern happiness to their futility. The Red Sox may have been cursed to fail as spectacularly as they have, but the Cubs are the victims of simple incompetence.
The 1950 Cubs were nothing special, and have no indication to their fans that they had played in the 1945 World Series and nearly won. Their offense was almost entirely dependant on home runs to generate runs. The 1950 Cubs hit 161 home runs, second in the league to the Dodgers 194. The Cubs were also second in Isolated Power at .153, .013 better than the league average and .022 better than the Phillies. Despite this strength at the plate, the Cubs were a terrible offensive team. They were dead-last in the NL in runs scored at 643. They had, by far, the lowest On-Base Percentage in the NL (.311), drew the fewest walks, and the lowest Gross Productive Average (GPA) in the game: .240 … The Cubs 643 runs scored under-performs their Base Runs (650), Batting Runs (656) and Runs Created (658). After home runs the only stat they led the league in was strikeouts.
Andy Pafko had an exceptional season with 121 Runs Created (8.88 Runs Created per 27 Outs) for the Cubs, as did 1952 MVP Hank Sauer (96 Runs Created, 6.39 Runs Created per 27 Outs), but the Cubs were too inconsistent at the plate to be the equal of the Dodgers.
If the Cubs offense was forgettable, than their pitching and defense were more so. Led by Bob Rush, who lost twenty games in 1950, the Cubs finished seventh in Fielding Independent Pitching (FIP), seventh in strikeouts, sixth in walks allowed, and sixth in ERA. Their lousy pitching was further undermined by a terrible defense. Defensively, the Cubs were the worst team in the NL, with a .694 DER, .007 worse than the Braves and Pirates and .035 worse than the Giants. The Cubs led the NL in errors with 198, 47 more than the Phillies, 61 more than the Giants and 71 more than the Dodgers. This was not a good defensive team. In fact, they allowed a whopping 120 un-earned runs! (.78 UERA)
The Cubs were never really in the playoff picture. After starting the season 3-0, they steadily dropped back in the standings. At the All-Star break the Cubs were 33-38 and ten games behind the Phillies. Their record would just get worse. The Cubs posted the worst post-All Star game record in the NL, going 31-51. On July 21 the Cubs swept a two-game series with the Braves and improved to 39-41, just seven games out of first place. They would lose seventeen of their next twenty-one games. After losing to the Pirates 7-4 on August 10, the Cubs were nineteen and a half games out of first and their season was finished. The Cubs would go 10-19 in September, finishing in seventh place, seven games ahead of the Pirates. The Cubs record since hasn’t been the best.
This season the Cubs are fast-approaching their centennial since their last World Series victory in 1908. Since then, the Cubs lost seven World Series all between 1910 and 1945. After the Cubs lost Game Seven of the 1945 World Series to the Detroit Tigers on October 10, 1945, they wouldn’t make the playoffs for another thirty-nine years! When they finally did in 1984, the Cubs proceeded to lose the NLCS to the San Diego Padres 3-2 despite winning the first two games 13-0 and 4-2. The Cubs have made the playoffs just three times since, losing the 1989 NLCS to the San Francisco Giants 4-1, losing the NLDS to the Braves 3-0 in 1998, and then, humiliatingly, losing the 2003 NLCS to the Marlins after leading the series 3-1 and being just five outs away from victory in Game Six before surrendering eight runs to lose 8-3. The Red Sox were able to pull themselves together after their collapse against the Yankees in Game 7 of the ALCS and win the 2004 World Series, but the Cubs continue to be the loveable losers of Wrigley Field.
Those were the also-rans.
Next, I’ll talk about what happened to the Phillies after the All-Star Break on Tuesday after I get done giving some thoughts on the World Series on Monday.
Previous Installments of the Wiz Kids:
Part VII: The Giants & Dodgers.
Part VI: Curt Simmons.
Part V: Robin Roberts.
Part IV: The first half of the 1950 season.
Part III: Jim Konstanty.
Part II: Eddie Sawyer.
Part I: The Path to 1950.
Prolouge.
Thursday, October 26, 2006
The Wiz Kids, Part VII: Focus on the Opposition … the New York teams
The Phillies two strongest foes in 1950 were the two New York teams, the Giants and Dodgers. Little would their fervent fans would realize, but both teams would depart their long-time home in just seven years, just one year removed from a period of time where they would dominate the National League. The Dodgers, the winners of 1947 and 1949 NL pennants, would go on to win the NL pennant in 1952, 1953, 1955 and 1956 before the team left for Los Angeles. The Giants meanwhile, would win the 1951 pennant in dramatic style before winning the ’54 pennant and World Series. They to would leave for the West Coast, arriving in San Francisco for the 1958 season. Aside from the Wiz Kids in '50, these two teams dominated the NL from 1947 to 1956.
The Brooklyn Dodgers.
Roy Campanella. Jackie Robinson. Pee Wee Reese. Duke Snider. Not many starting lineups can boast four Hall of Fame baseball players, but the 1950 Brooklyn Dodgers did. Campanella, Robinson, Resse and Snider combined to form the core of a lineup that was more fearsome than any other fielded in 1950. The Dodgers scored 847 runs that season, 62 more than the Boston Braves, 112 more than the Giants and 125 more than the Phillies. They were easily the most impressive team in the NL offensively. The Dodgers led the NL in nearly every category, from home runs (33 better than the second-place Cubs), to batting average (.272, .007 better than the Phillies), to OBP (.346, .007 better than the Braves), to slugging percentage (.444, .038 better than the Pirates), to stolen bases (77, 6 better than the Braves). They were a fearsome offensive machine that got on base, advanced runners and blasted home runs.
Confused about what I’m talking about? Here are the stats I refer to defined:
Gross Productive Average (GPA): (1.8 * .OBP + .SLG) / 4 = .GPA. Invented by The Hardball Times Aaron Gleeman, GPA measures a players production by weighing his ability to get on base and hit with power. This is my preferred all-around stat.
Isolated Power (ISO): .SLG - .BA = .ISO. Measures a player’s raw power by subtracting singles from their slugging percentage.
On-Base Percentage (OBP): How often a player gets on base. (H + BB + HBP) / (Plate Appearances)
Walks per plate appearance (BB/PA): BB / PA = .BB/PA Avg
Slugging Percentage (SLG): Total Bases / At-Bats = Slugging Percentage. Power at the plate.
Runs Created (RC): A stat originally created by Bill James to measure a player’s total contribution to his team’s lineup. The formula I use for this article is taken from Bill James Historical Abstract circa 1988, when he developed special formulas for Runs Created based on stats that the MLB kept (e.g., caught stealing wasn't a stat baseball kept track of until 1951). The formula is: [(H + BB + HBP - GIDP) times (Total Bases + .26 * (BB + HBP) + .52 * SH)] divided by (AB + BB + HBP + SH).
RC/27: Runs Created per 27 outs, essentially what a team of 9 of this player would score in a hypothetical game.
Base Runs: Developed by Dave Smyth as an alternative to Runs Created. Here is the formula: (A: H + BB + HBP – HR ; B: (.8 * 1B) + (2.1 * 2B) + (3.4 * 3B) + (1.8 * HR) + (.1*(BB + HBP)); C: AB – H; D: HR) Then simply divide B into B + C, then multiply A to the result and add D.
WHIP – Walks plus hits by innings pitched: (BB + H) / IP = WHIP
ERA – Earned Run Average: (Earned Runs * 9) / IP = ERA
FIP – Fielding Independent Pitching: (13*HR+3*BB-2*K / IP) + League Factor Evaluates a pitching by how he would have done with an average defense behind him by keeping track of things that a pitcher can control (walks, strikeouts, home runs allowed) as opposed to things he cannot (hits allowed, runs allowed).
DER – Defense Efficiency Ratio: (Batters Faced – (Hits + Walks + Hit By Pitch + Strikeouts)) / (Batters Faced – (Home Runs, Walks + Hit By Pitch + Strikeouts)) How often fielders convert balls put into play into outs.
In particular, Duke Snider had an amazing season: 31 home runs, 31 doubles, 10 triples, .321 Batting Average, 107 RBIs, 109 Runs Scored. A sabremetric look at his numbers says a lot more: Snider had a .309 Gross Productive Average (GPA) and a .232 Isolated Power (ISO). Snider led the Dodgers in Runs Created (RC) and Base Runs (BsR):
Runs Created:
Snider: 133
Robinson: 116
Hodges: 116
Furillo: 98
Reese: 90
Campanella: 83
Base Runs:
Snider: 118
Robinson: 107
Hodges: 100
Furillo: 93
Campanella: 83
Reese: 77
The Dodgers best hitter in terms of raw power was catcher Campanella, who had a .270 ISO (31 home runs despite having just 75% of the AB’s as guys like Snider). Their top hitter overall was Jackie Robinson, who led the team with a .315 GPA. #42 only had 14 home runs, fifth on the team, but he did lead the Dodgers in doubles with 39 and drew 80 walks with only 24 strikeouts. Yes, Jackie Robinson struck out in just 4% of his plate appearances. I wonder if anyone was ever as difficult to strikeout as Jackie Robinson*.
* Ok, I checked it out and I think I found someone a little more difficult to K: in 1941 Joe DiMaggio struck out just 13 times in 621 plate appearances. That’s 2%. Still, Jackie Robinson did pretty good in '50!
The Dodgers, however, struggled in many other aspects of the game. In terms of pitching, the Dodgers really struggled. While it is true that the Dodgers led the NL in strikeouts (5.00 per nine innings, 0.45 better than the Reds, 1.03 better than the Phillies), they were fifth in the NL in allowing walks (3.83 per nine innings) and worst in allowing home runs (1.06 per nine innings). Given that the top slugging team in the NL was themselves, that means they must have been very susceptible to the long-ball.
As a consequence they rank sixth in the NL in terms of Fielding Independent Pitching (FIP) ERA:
Phillies: 3.89
Cardinals: 3.95
Braves: 4.04
Giants: 4.14
Reds: 4.17
Dodgers: 4.20
Cubs: 4.23
Pirates: 4.50
League: 4.14
This isn’t to say that the Dodgers didn’t have talent. They had Don Newcombe, the firey power pitcher who was every bit as good as the Phillies Robin Roberts:
FIP ERA:
Roberts: 3.55
Newcombe: 3.45
Roberts / Newcombe
HR/9: 0.86 / 0.74
K/9: 4.32 / 4.38
BB/9: 2.28 / 2.52
Newcombe was helped by the fact that he got to face the light-hitting Phillies instead of the Dodgers like Roberts, and that Roberts threw nearly forty more innings than Newcombe, which means that his arm was much more tired. Roberts would later out-duel Newcombe on the final day of the 1950 season to capture the pennant for the Phillies. (see, Part XII of this series.)
The rest of the Dodgers pitching staff was a bust. Preacher Roe, the former Phillie, was nowhere near as good as his 3.30 ERA indicated: his FIP ERA was 4.07. Roe surrendered 34 home runs in 250 innings, 1.22 per nine innings. He was largely saved by good defensive work. After Roe and Newcombe, the quality of the Dodgers staff fell off quickly: poor Ralph Branca, who would go down in infamy as the man who surrendered Bobby Thomson’s “Shot Heard ‘Round the World” the next year, in particular struggled in 1950.
The Dodgers pitchers weren’t helped by the fact that the Dodgers fielding wasn’t great: the team Defense Efficiency Ratio (DER) was just .703, which ranked them fourth behind the Giants (.729), the Phillies (.719), and the Reds (.708). The Dodgers appeared to have a strong middle defense with Pee Wee Reese and Jackie Robinson, but looked weak everywhere else.
The Dodgers reliance on slugging as opposed to pitching and defense would come back to haunt them: they went 23-21 in one-run ball games while the Phillies went 30-16. The inability to win close games led to the Dodgers offensive output being wasted: of their 89 victories in 1950, 29 of them were by five runs or more. Their inability to scatter those runs more consistently throughout the season led to feast-or-famine games. Had the Dodgers equaled the Phillies .652 winning percentage in one-run games in their 44 one-run contests, the Dodgers would have won 95 games in 1950 and won the NL by four games.
However, that is pure speculation. The Dodgers did fall short to the Phillies.
The New York Giants.
The New York Giants, in contrast, were a team built around pitching and defense. The Giants led the National League in Defense Efficiency Ratio (DER) by a wide margin:
DER:
Giants: .729
Phillies: .719
Reds: .708
Dodgers: .703
Cardinals: .702
Braves: .701
Pirates: .701
Cubs: .694
The Giants prowess in defense helped obscure the fact that the Giants pitching was good but not great. While the Phillies ERA does rise from 3.50 to 3.89 once you make it defense neutral, it remains the best in the NL by a pretty wide margin. The Giants, in contrast, see their team ERA spike from 3.71 to 4.14, a 0.43 increase. 4.14 is actually the NL average for ERA in 1950, so the Giants fall from the top to the exact middle. In short, the Giants go from having the second-best ERA in the majors to having an average pitching staff once you make their stats defense neutral.
The Giants had some good pitchers in 1950. Larry Jansen was a formidable pitcher, hurling a 3.41 FIP ERA (a 3.01 “real” ERA) in 275 innings of work. Jansen’s 275 innings were fifth-most in the NL, and his 1.07 WHIP was best in the NL. Sal Maglie, who led the NL in ERA in 1950, also turned in an excellent season. Maglie was stingy with surrendering home runs (0.61 per nine innings), but clearly benefited from his defense: his league-leading 2.71 ERA hides a 3.72 FIP ERA.
After Jansen and Maglie the quality of the Giants pitching tails off.
Offensively, the Giants weren’t much to speak of. They hit roughly the league average in GPA: .250. Their Isolated Power was .134, below the NL average of .140 that season. They scored 4.77 runs per game, slightly better than the league average of 4.66 … The Giants probably played above their heads: according to the Base Runs formulas, the Giants over-performed: scoring 735 runs when Base Runs had them at 705. Runs Created actually suggests they slightly under-performed by three runs, however.
The Giants offensive weapon was Eddie Stanky, their second-baseman. Stanky might have been the most under-rated player in the NL in 1950, drawing 144 walks in addition to getting 158 hits and scoring 115 runs. Stanky got on base 314 times in 1950, which led the league, and his OBP was a Barry Bonds-like .460. Not even Richie Ashburn (on-base 245 times with a .402 OBP) could do that. Stanky had 121 Runs Created and 114 Base Runs, roughly 16% of his team’s total in both stats. Without Stanky setting the table for the Giants middle order of Bobby Thomson, Hank Thompson and Monte Irvin, the Giants would have been pretty punch-less on offense.
The next season the Giants continued to be a defense oriented team with decent pitching, but dramatically improved offense, which featured Irvin, who led the league in RBIs with 121 (and had 127 Runs Created), and Rookie of the Year Willie Mays, who hit 20 home runs and had 69 RBIs. After losing to the Phillies 4-0 on August 11, 1950, the Giants swept the next three games against the Phillies and won 39 of their final 47 games. They miraculously closed the gap despite the fact that the Dodgers really didn’t play bad baseball (27-24, .529) over the final two months of the season. The season culminated in Bobby Thomson’s home run and the Giants went into the history books.
I'll comment on the World Series tomorrow if they actually get to play and post Part VIII of the series.
Previous Installments of the Wiz Kids:
Part VI: Curt Simmons.
Part V: Robin Roberts.
Part IV: The first half of the 1950 season.
Part III: Jim Konstanty.
Part II: Eddie Sawyer.
Part I: The Path to 1950.
Prolouge.
(0) comments
The Brooklyn Dodgers.
Roy Campanella. Jackie Robinson. Pee Wee Reese. Duke Snider. Not many starting lineups can boast four Hall of Fame baseball players, but the 1950 Brooklyn Dodgers did. Campanella, Robinson, Resse and Snider combined to form the core of a lineup that was more fearsome than any other fielded in 1950. The Dodgers scored 847 runs that season, 62 more than the Boston Braves, 112 more than the Giants and 125 more than the Phillies. They were easily the most impressive team in the NL offensively. The Dodgers led the NL in nearly every category, from home runs (33 better than the second-place Cubs), to batting average (.272, .007 better than the Phillies), to OBP (.346, .007 better than the Braves), to slugging percentage (.444, .038 better than the Pirates), to stolen bases (77, 6 better than the Braves). They were a fearsome offensive machine that got on base, advanced runners and blasted home runs.
Confused about what I’m talking about? Here are the stats I refer to defined:
Gross Productive Average (GPA): (1.8 * .OBP + .SLG) / 4 = .GPA. Invented by The Hardball Times Aaron Gleeman, GPA measures a players production by weighing his ability to get on base and hit with power. This is my preferred all-around stat.
Isolated Power (ISO): .SLG - .BA = .ISO. Measures a player’s raw power by subtracting singles from their slugging percentage.
On-Base Percentage (OBP): How often a player gets on base. (H + BB + HBP) / (Plate Appearances)
Walks per plate appearance (BB/PA): BB / PA = .BB/PA Avg
Slugging Percentage (SLG): Total Bases / At-Bats = Slugging Percentage. Power at the plate.
Runs Created (RC): A stat originally created by Bill James to measure a player’s total contribution to his team’s lineup. The formula I use for this article is taken from Bill James Historical Abstract circa 1988, when he developed special formulas for Runs Created based on stats that the MLB kept (e.g., caught stealing wasn't a stat baseball kept track of until 1951). The formula is: [(H + BB + HBP - GIDP) times (Total Bases + .26 * (BB + HBP) + .52 * SH)] divided by (AB + BB + HBP + SH).
RC/27: Runs Created per 27 outs, essentially what a team of 9 of this player would score in a hypothetical game.
Base Runs: Developed by Dave Smyth as an alternative to Runs Created. Here is the formula: (A: H + BB + HBP – HR ; B: (.8 * 1B) + (2.1 * 2B) + (3.4 * 3B) + (1.8 * HR) + (.1*(BB + HBP)); C: AB – H; D: HR) Then simply divide B into B + C, then multiply A to the result and add D.
WHIP – Walks plus hits by innings pitched: (BB + H) / IP = WHIP
ERA – Earned Run Average: (Earned Runs * 9) / IP = ERA
FIP – Fielding Independent Pitching: (13*HR+3*BB-2*K / IP) + League Factor Evaluates a pitching by how he would have done with an average defense behind him by keeping track of things that a pitcher can control (walks, strikeouts, home runs allowed) as opposed to things he cannot (hits allowed, runs allowed).
DER – Defense Efficiency Ratio: (Batters Faced – (Hits + Walks + Hit By Pitch + Strikeouts)) / (Batters Faced – (Home Runs, Walks + Hit By Pitch + Strikeouts)) How often fielders convert balls put into play into outs.
In particular, Duke Snider had an amazing season: 31 home runs, 31 doubles, 10 triples, .321 Batting Average, 107 RBIs, 109 Runs Scored. A sabremetric look at his numbers says a lot more: Snider had a .309 Gross Productive Average (GPA) and a .232 Isolated Power (ISO). Snider led the Dodgers in Runs Created (RC) and Base Runs (BsR):
Runs Created:
Snider: 133
Robinson: 116
Hodges: 116
Furillo: 98
Reese: 90
Campanella: 83
Base Runs:
Snider: 118
Robinson: 107
Hodges: 100
Furillo: 93
Campanella: 83
Reese: 77
The Dodgers best hitter in terms of raw power was catcher Campanella, who had a .270 ISO (31 home runs despite having just 75% of the AB’s as guys like Snider). Their top hitter overall was Jackie Robinson, who led the team with a .315 GPA. #42 only had 14 home runs, fifth on the team, but he did lead the Dodgers in doubles with 39 and drew 80 walks with only 24 strikeouts. Yes, Jackie Robinson struck out in just 4% of his plate appearances. I wonder if anyone was ever as difficult to strikeout as Jackie Robinson*.
* Ok, I checked it out and I think I found someone a little more difficult to K: in 1941 Joe DiMaggio struck out just 13 times in 621 plate appearances. That’s 2%. Still, Jackie Robinson did pretty good in '50!
The Dodgers, however, struggled in many other aspects of the game. In terms of pitching, the Dodgers really struggled. While it is true that the Dodgers led the NL in strikeouts (5.00 per nine innings, 0.45 better than the Reds, 1.03 better than the Phillies), they were fifth in the NL in allowing walks (3.83 per nine innings) and worst in allowing home runs (1.06 per nine innings). Given that the top slugging team in the NL was themselves, that means they must have been very susceptible to the long-ball.
As a consequence they rank sixth in the NL in terms of Fielding Independent Pitching (FIP) ERA:
Phillies: 3.89
Cardinals: 3.95
Braves: 4.04
Giants: 4.14
Reds: 4.17
Dodgers: 4.20
Cubs: 4.23
Pirates: 4.50
League: 4.14
This isn’t to say that the Dodgers didn’t have talent. They had Don Newcombe, the firey power pitcher who was every bit as good as the Phillies Robin Roberts:
FIP ERA:
Roberts: 3.55
Newcombe: 3.45
Roberts / Newcombe
HR/9: 0.86 / 0.74
K/9: 4.32 / 4.38
BB/9: 2.28 / 2.52
Newcombe was helped by the fact that he got to face the light-hitting Phillies instead of the Dodgers like Roberts, and that Roberts threw nearly forty more innings than Newcombe, which means that his arm was much more tired. Roberts would later out-duel Newcombe on the final day of the 1950 season to capture the pennant for the Phillies. (see, Part XII of this series.)
The rest of the Dodgers pitching staff was a bust. Preacher Roe, the former Phillie, was nowhere near as good as his 3.30 ERA indicated: his FIP ERA was 4.07. Roe surrendered 34 home runs in 250 innings, 1.22 per nine innings. He was largely saved by good defensive work. After Roe and Newcombe, the quality of the Dodgers staff fell off quickly: poor Ralph Branca, who would go down in infamy as the man who surrendered Bobby Thomson’s “Shot Heard ‘Round the World” the next year, in particular struggled in 1950.
The Dodgers pitchers weren’t helped by the fact that the Dodgers fielding wasn’t great: the team Defense Efficiency Ratio (DER) was just .703, which ranked them fourth behind the Giants (.729), the Phillies (.719), and the Reds (.708). The Dodgers appeared to have a strong middle defense with Pee Wee Reese and Jackie Robinson, but looked weak everywhere else.
The Dodgers reliance on slugging as opposed to pitching and defense would come back to haunt them: they went 23-21 in one-run ball games while the Phillies went 30-16. The inability to win close games led to the Dodgers offensive output being wasted: of their 89 victories in 1950, 29 of them were by five runs or more. Their inability to scatter those runs more consistently throughout the season led to feast-or-famine games. Had the Dodgers equaled the Phillies .652 winning percentage in one-run games in their 44 one-run contests, the Dodgers would have won 95 games in 1950 and won the NL by four games.
However, that is pure speculation. The Dodgers did fall short to the Phillies.
The New York Giants.
The New York Giants, in contrast, were a team built around pitching and defense. The Giants led the National League in Defense Efficiency Ratio (DER) by a wide margin:
DER:
Giants: .729
Phillies: .719
Reds: .708
Dodgers: .703
Cardinals: .702
Braves: .701
Pirates: .701
Cubs: .694
The Giants prowess in defense helped obscure the fact that the Giants pitching was good but not great. While the Phillies ERA does rise from 3.50 to 3.89 once you make it defense neutral, it remains the best in the NL by a pretty wide margin. The Giants, in contrast, see their team ERA spike from 3.71 to 4.14, a 0.43 increase. 4.14 is actually the NL average for ERA in 1950, so the Giants fall from the top to the exact middle. In short, the Giants go from having the second-best ERA in the majors to having an average pitching staff once you make their stats defense neutral.
The Giants had some good pitchers in 1950. Larry Jansen was a formidable pitcher, hurling a 3.41 FIP ERA (a 3.01 “real” ERA) in 275 innings of work. Jansen’s 275 innings were fifth-most in the NL, and his 1.07 WHIP was best in the NL. Sal Maglie, who led the NL in ERA in 1950, also turned in an excellent season. Maglie was stingy with surrendering home runs (0.61 per nine innings), but clearly benefited from his defense: his league-leading 2.71 ERA hides a 3.72 FIP ERA.
After Jansen and Maglie the quality of the Giants pitching tails off.
Offensively, the Giants weren’t much to speak of. They hit roughly the league average in GPA: .250. Their Isolated Power was .134, below the NL average of .140 that season. They scored 4.77 runs per game, slightly better than the league average of 4.66 … The Giants probably played above their heads: according to the Base Runs formulas, the Giants over-performed: scoring 735 runs when Base Runs had them at 705. Runs Created actually suggests they slightly under-performed by three runs, however.
The Giants offensive weapon was Eddie Stanky, their second-baseman. Stanky might have been the most under-rated player in the NL in 1950, drawing 144 walks in addition to getting 158 hits and scoring 115 runs. Stanky got on base 314 times in 1950, which led the league, and his OBP was a Barry Bonds-like .460. Not even Richie Ashburn (on-base 245 times with a .402 OBP) could do that. Stanky had 121 Runs Created and 114 Base Runs, roughly 16% of his team’s total in both stats. Without Stanky setting the table for the Giants middle order of Bobby Thomson, Hank Thompson and Monte Irvin, the Giants would have been pretty punch-less on offense.
The next season the Giants continued to be a defense oriented team with decent pitching, but dramatically improved offense, which featured Irvin, who led the league in RBIs with 121 (and had 127 Runs Created), and Rookie of the Year Willie Mays, who hit 20 home runs and had 69 RBIs. After losing to the Phillies 4-0 on August 11, 1950, the Giants swept the next three games against the Phillies and won 39 of their final 47 games. They miraculously closed the gap despite the fact that the Dodgers really didn’t play bad baseball (27-24, .529) over the final two months of the season. The season culminated in Bobby Thomson’s home run and the Giants went into the history books.
I'll comment on the World Series tomorrow if they actually get to play and post Part VIII of the series.
Previous Installments of the Wiz Kids:
Part VI: Curt Simmons.
Part V: Robin Roberts.
Part IV: The first half of the 1950 season.
Part III: Jim Konstanty.
Part II: Eddie Sawyer.
Part I: The Path to 1950.
Prolouge.
Wednesday, October 25, 2006
The Wiz Kids, Part VI: Focus on Curt Simmons
People don’t remember what a fantastic set of pitchers the Phillies had for the 1950 campaign with Konstanty, Roberts and Curt Simmons. I’ve already discussed what made Konstanty, the 1950 N.L. MVP, and Roberts special, but I haven’t yet discussed the third part of the Phillies pitching triad: Curt Simmons.
Curt Simmons story beg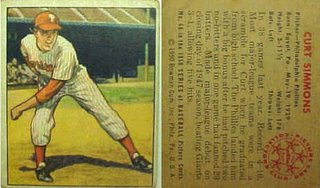 ins in Egypt, Pennsylvania, north of Philadelphia near Allentown. Simmons was a high school phenom astonishing baseball scouts with his tremendous abilities. In one game, for example, Simmons K’d 23 batters. With other scouts pursuing his services, the Phillies decided to send the team north to play an expedition game against Simmons high school team, with the idea being that once Simmons was hammered by big league hitters, the demand for his abilities would go down and make him more affordable. When Simmons K’d twelve Phillies in the game, a 4-4 tie, the Phillies suddenly found themselves in a protracted bidding war with several other teams. In the end the Phillies won, forking over an astonishing $65,000 signing bonus for Simmons services. The bonus baby, just eighteen, entered the Phillies farm system in Wilmington, and devoured the minor league hitters he faced. Simmons was promoted to the Phillies and pitched the final game of the 1947 season, hurling a masterful 3-1 complete game victory over the New York Giants, striking out nine Giants and allowing just one run.
Let me start off by saying that I am going to be using a lot of stats in this article. If you are confused about what I’m talking about, then here are the stats I refer to defined:
WHIP – Walks plus hits by innings pitched: (BB + H) / IP = WHIP
ERA – Earned Run Average: (Earned Runs * 9) / IP = ERA
FIP – Fielding Independent Pitching: (13*HR+3*BB-2*K / IP) + League Factor Evaluates a pitching by how he would have done with an average defense behind him by keeping track of things that a pitcher can control (walks, strikeouts, home runs allowed) as opposed to things he cannot (hits allowed, runs allowed).
HR/9 – Home Runs allowed per nine innings: (HR * 9) / IP
K/9 – Strikeouts per nine innings: (K * 9) / IP
BB/9 – Walks per nine innings: (BB * 9) / IP
For the next two seasons Simmons struggled badly. Going into the 1950 season there were many questions about whether Simmons was going to be a good hurler for the Phils: he was 12-23 with a 4.64 ERA from 1947 to 1949. Robin Roberts, in contrast, was just two games shy of a .500 record and his ERA was a full run lower. What is striking about Simmons first two full seasons in the majors is that he was able to keep the ball in the park quite a bit, but that he had major control issues. Here are Simmons stats for those seasons:
1948 / 1949
HR/9: 0.42 / 0.48
BB/9: 5.71 / 3.77
K/9: 4.55 / 5.70
ERA: 4.87 / 4.59
W-L: 7-13 / 4-10
But the next three seasons would be triumphs for Simmons. One of the biggest surprises of the 1950 campaign was how exceptionally dominating Curt Simmons pitched. That season he threw 214 & 2/3 innings and went 17-8 with eleven complete games. His numbers were a major improvement from the ’48 and ’49 campaigns.
1950:
HR/9: 0.79
BB/9: 3.68
K/9: 6.11
ERA: 3.40
FIP ERA: 3.53
W-L: 17-8
Combined with Roberts, Konstanty and the rest of the Phillies staff, Simmons helped the Phillies be the best pitching team in the National League. Simmons made an interesting contrast to Roberts: more of a flamethrowing strikeout artist in contrast to Roberts cool, methodical control pitcher. A contemporary observer stated: “Robin Roberts had less dazzling stuff than Simmons …” (Neyer / James Guides to Pitchers, page 385, quoting Sport Magazine, June of 1964.) Roberts himself appreciated Simmons ying to his yang. Said Roberts: “[Simmons] certainly did not disappoint, throwing harder and with more movement on the ball than anyone I had ever seen. He also had a peculiar delivery that hid the ball from the batter." (Neyer / James, quoting My Life In Baseball by Robin Roberts.)
Who was the better pitcher that season? In many ways, Simmons was as good if not better than Roberts. Take a quick gander at the numbers:
Simmons vs. Roberts: ‘50
FIP: 3.53 / 3.55
ERA: 3.40 / 3.02
HR/9: 0.79 / 0.86
BB/9: 3.68 / 2.28
K/9: 6.11 / 4.32
WHIP: 1.23 / 1.18
Roberts did throw nearly a hundred more innings than Simmons that season and was virtually the Phillies only pitcher down the stretch when they were busy trying to hold onto their slim lead over the Dodgers. So Roberts was the better pitcher in 1950, but Simmons was vital to the reason why the Phillies built a lead in August of 1950 in the pennant race.
The hard throws and the peculiar delivery were Simmons hallmarks as a major leaguer. According to author Will Marshall: “[Simmons] herky-jerky motion prevented batters from picking up the ball readily. More ever, the left-handed Simmons’ cross-fire delivery, which came from the direction of first base, intimidated left-handed hitters. His pitching repertoire consisted of two fastballs – one that took off and another that dipped – an excellent change-up and a hard-breaking curve.” (Neyer /James, quoting Baseball’s Pivotal Era: 1945-1951.) Simmons force and the trajectory he delivered it made it a difficult pitch to put into play for a hit even when someone could make contact. Said the Giants Whitey Lockman: “[Simmons] ball was a heavy ball and even when I hit it, I felt like I hit a rock.” (Neyer / James.)
Thanks to North Korea’s decision to invade South Korea in the summer of 1950, Simmons was forced to sign up with a National Guard unit to avoid being drafted by the Army. Unfortunately for Simmons, his National Guard unit was called up in mid-September. The effect Simmons absence on the Phillies roster was immediate. Down the stretch the Phillies saw their six-game lead evaporate as their pitching staff grew perilously thin. Roberts actually had to start three of the Phillies final five games of the season and was so worn down from the dramatic victory over the Dodgers on October 1, that he was unable to start Game One of the World Series. As you’ll see in a future installment of this series, the Phillies defeat in the 1950 World Series was due to a lack of offense instead of a lack of quality pitching, but Simmons absence in the Series impacted the team.
Simmons remained in uniform in 1951, missing the entire season. A crucial reason for why the 1951 Phillies fell short to the Giants and Dodgers was Simmons absence: the decline in Jim Konstanty’s performance, the decline in Del Ennis’ performance and the overall slip in the quality of the Phillies offense put more pressure on a pitching staff that was suddenly much, much thinner than it had been.
Simmons returned in 1952 and had probably his best season as a Phillie:
1952:
HR/9: 0.49
BB/9: 3.13
K/9: 6.31
ERA: 2.82
FIP ERA: 2.84
W-L: 14-8
WHIP: 1.19
1952 was also probably Robin Roberts finest season as a pitcher: 28-7, 2.59 ERA (2.86 FIP). With Simmons back the Phillies once more had the best pitching staff in the majors, with a team ERA of just 3.07, nearly a half run better than the second-place Dodgers at 3.53. Unfortunately the Phillies finished in fourth place, nine and a half games behind the Dodgers thanks to the Dodgers fearsome offense, which the lighter-hitting Phillies could not match.
The ’52 campaign was a major triumph for Simmons: he started the 1952 All-Star Game at Shibe Park in Philadelphia. It was the third straight year a Phillie had done so (Roberts started in ’50 & ’51), and it would be the first of Simmons two All-Star Game starts.
Simmons got off to another great start in 1953, pitching a one-hitter against the Boston Braves where he got 27 consecutive batters out after allowing a lead-off single. Unfortunately, Simmons suffered a freak injury in 1953 when he accidentally ran over his foot with his lawn mower and injured in big toe. As in 1950, as in 1952, Curt Simmons wouldn’t reach the magical number of twenty wins in 1953. He finished strong, but it wasn’t quite on par with ’50 and ’52:
1953:
HR/9: 0.65
BB/9: 3.10
K/9: 5.22
ERA: 3.21
FIP ERA: 3.49
W-L: 16-13
WHIP: 1.24
Simmons turned in another good performance in 1954, going 14-15 with a 2.81 ERA, his career low ERA. Despite his impressive performance – nonwithstanding the mirage of his win-loss record – Simmons didn’t make the ’54 All-Star roster. Simmons struggled in 1955, going just 8-8, before returning to his old form in 1956 with a 15-10 record. Here are Simmons stats for those seasons:
1954 / 1955 / 1956
FIP: 3.37 / 4.14 / 3.50
ERA: 2.81 / 4.92 / 3.36
HR/9: 0.53 / 1.04 / 0.78
BB/9: 3.49 / 3.47 / 2.96
K/9: 4.45 / 4.02 / 4.00
WHIP: 1.28 / 1.53 / 1.27
W-L: 14-15 / 8-8 / 15-10
In 1957 Simmons returned with the finest season he had since ’52. Once more Simmons started in the All-Star Game, the seventh time in eight years that a Phillie pitcher had started. Unfortunately, the ’57 Phillies just weren’t very good, scoring the second-fewest runs in the N.L. that season. Roberts went 10-22. Despite Simmons great season, the Phillies went 77-77 and finished eighteen games behind the first-place Milwaukee Braves. Here are Curt’s stats:
1957:
HR/9: 0.47
BB/9: 2.13
K/9: 3.91
ERA: 3.44
FIP ERA: 3.09
W-L: 12-11
WHIP: 1.25
What struck me as interesting was that Curt was more of a strikeout artist throughout his career, especially in contrast to Roberts, a control pitcher who was more apt at not surrendering walks than getting strikeouts. ’57 was a major change for him: it was, by far, the lowest walks per nine innings pitched he surrendered in his career. It was also the fewest strikeouts he had gotten per nine innings in his career. Compare his walks and strikeouts in 1950, 1952 and 1957:
1950 / 1952 / 1957
BB/9: 3.68 / 3.13 / 2.13
K/9: 6.11 / 6.31 / 3.91
Those are startling changes. He was becoming a different pitcher. Unfortunately, 1957 was pretty much the end of the line for Curt Simmons as a Phillie. In 1958 he went 7-14 with a 4.38 ERA which was much worse than his 3.20 FIP ERA. Simmons hurled just ten innings in 1959 and was released by the team in 1960, whereupon the St. Louis Cardinals wisely snapped him up. Simmons suddenly became an anchor on a very strong Cardinals team. In 1964 Simmons turned in his finest performance since 1957, going 18-9 (a career high in wins) with a 3.43 ERA. A look at Simmons stats from that season shows how he morphed from being a flamethrower to a Robin Roberts-like control pitcher:
HR/9: 0.89
BB/9: 1.80
K/9: 3.84
Simmons enabled the Cardinals to sweep up from behind the Phillies and stun the ’64 Phils by coming from six and a half games back on September 20, 1964, to win the pennant. On September 30, 1964, Simmons defeated Jim Bunning 8-5 at Busch Stadium, scattering five hits over eight innings, striking out two Phillies and not allowing a walk, in a masterful game that ran the Phillies losing streak to ten games and effectively ended their season and completed one of the darkest moments in Phillies history. It was the Cards eighth consecutive victory. Simmons started games three and six for the Cardinals, both defeats, although Simmons wasn’t the losing pitcher in their 2-1 loss in Game Three when Mickey Mantle drove a Barney Schultz knuckleball out of the field for a home run in the bottom of the ninth. After being denied an opportunity to play in the ’50 World Series, '64 was Simmons sole taste of post-season glory.
Simmons left the Cards during the ’66 season and briefly pitched for the Chicago Cubs, alongside his old Phillies teammate, Robin Roberts. The 1967 season was his last. Simmons retired that season.
In the final analysis I think a few things are noteworthy about the life and career of Curt Simmons: he was a very integral part of those teams that the Phillies fielded in the 1950s that came close to the edge of competing yet consistently fell short. He’d probably be more remembered in the history of Philly sports if he had won twenty games, something he never did and Roberts did six consecutive seasons from 1950 to 1955. Curt Simmons deserves to be remembered as a dominant pitcher and a big part of Phillies baseball in the 1950s. It is too bad that the Korean War interfered with his season in 1950, because he almost certainly would have won twenty games that season, and might have won twenty and helped the Phillies compete in 1951 as well.
It is a sad, "what-if" of history. Good work, Curt.
Previous Installments of the Wiz Kids:
Part V: Robin Roberts.
Part IV: The first half of the 1950 season.
Part III: Jim Konstanty.
Part II: Eddie Sawyer.
Part I: The Path to 1950.
Prolouge.
(1) comments
Curt Simmons story beg
 ins in Egypt, Pennsylvania, north of Philadelphia near Allentown. Simmons was a high school phenom astonishing baseball scouts with his tremendous abilities. In one game, for example, Simmons K’d 23 batters. With other scouts pursuing his services, the Phillies decided to send the team north to play an expedition game against Simmons high school team, with the idea being that once Simmons was hammered by big league hitters, the demand for his abilities would go down and make him more affordable. When Simmons K’d twelve Phillies in the game, a 4-4 tie, the Phillies suddenly found themselves in a protracted bidding war with several other teams. In the end the Phillies won, forking over an astonishing $65,000 signing bonus for Simmons services. The bonus baby, just eighteen, entered the Phillies farm system in Wilmington, and devoured the minor league hitters he faced. Simmons was promoted to the Phillies and pitched the final game of the 1947 season, hurling a masterful 3-1 complete game victory over the New York Giants, striking out nine Giants and allowing just one run.
Let me start off by saying that I am going to be using a lot of stats in this article. If you are confused about what I’m talking about, then here are the stats I refer to defined:
WHIP – Walks plus hits by innings pitched: (BB + H) / IP = WHIP
ERA – Earned Run Average: (Earned Runs * 9) / IP = ERA
FIP – Fielding Independent Pitching: (13*HR+3*BB-2*K / IP) + League Factor Evaluates a pitching by how he would have done with an average defense behind him by keeping track of things that a pitcher can control (walks, strikeouts, home runs allowed) as opposed to things he cannot (hits allowed, runs allowed).
HR/9 – Home Runs allowed per nine innings: (HR * 9) / IP
K/9 – Strikeouts per nine innings: (K * 9) / IP
BB/9 – Walks per nine innings: (BB * 9) / IP
For the next two seasons Simmons struggled badly. Going into the 1950 season there were many questions about whether Simmons was going to be a good hurler for the Phils: he was 12-23 with a 4.64 ERA from 1947 to 1949. Robin Roberts, in contrast, was just two games shy of a .500 record and his ERA was a full run lower. What is striking about Simmons first two full seasons in the majors is that he was able to keep the ball in the park quite a bit, but that he had major control issues. Here are Simmons stats for those seasons:
1948 / 1949
HR/9: 0.42 / 0.48
BB/9: 5.71 / 3.77
K/9: 4.55 / 5.70
ERA: 4.87 / 4.59
W-L: 7-13 / 4-10
But the next three seasons would be triumphs for Simmons. One of the biggest surprises of the 1950 campaign was how exceptionally dominating Curt Simmons pitched. That season he threw 214 & 2/3 innings and went 17-8 with eleven complete games. His numbers were a major improvement from the ’48 and ’49 campaigns.
1950:
HR/9: 0.79
BB/9: 3.68
K/9: 6.11
ERA: 3.40
FIP ERA: 3.53
W-L: 17-8
Combined with Roberts, Konstanty and the rest of the Phillies staff, Simmons helped the Phillies be the best pitching team in the National League. Simmons made an interesting contrast to Roberts: more of a flamethrowing strikeout artist in contrast to Roberts cool, methodical control pitcher. A contemporary observer stated: “Robin Roberts had less dazzling stuff than Simmons …” (Neyer / James Guides to Pitchers, page 385, quoting Sport Magazine, June of 1964.) Roberts himself appreciated Simmons ying to his yang. Said Roberts: “[Simmons] certainly did not disappoint, throwing harder and with more movement on the ball than anyone I had ever seen. He also had a peculiar delivery that hid the ball from the batter." (Neyer / James, quoting My Life In Baseball by Robin Roberts.)
Who was the better pitcher that season? In many ways, Simmons was as good if not better than Roberts. Take a quick gander at the numbers:
Simmons vs. Roberts: ‘50
FIP: 3.53 / 3.55
ERA: 3.40 / 3.02
HR/9: 0.79 / 0.86
BB/9: 3.68 / 2.28
K/9: 6.11 / 4.32
WHIP: 1.23 / 1.18
Roberts did throw nearly a hundred more innings than Simmons that season and was virtually the Phillies only pitcher down the stretch when they were busy trying to hold onto their slim lead over the Dodgers. So Roberts was the better pitcher in 1950, but Simmons was vital to the reason why the Phillies built a lead in August of 1950 in the pennant race.
The hard throws and the peculiar delivery were Simmons hallmarks as a major leaguer. According to author Will Marshall: “[Simmons] herky-jerky motion prevented batters from picking up the ball readily. More ever, the left-handed Simmons’ cross-fire delivery, which came from the direction of first base, intimidated left-handed hitters. His pitching repertoire consisted of two fastballs – one that took off and another that dipped – an excellent change-up and a hard-breaking curve.” (Neyer /James, quoting Baseball’s Pivotal Era: 1945-1951.) Simmons force and the trajectory he delivered it made it a difficult pitch to put into play for a hit even when someone could make contact. Said the Giants Whitey Lockman: “[Simmons] ball was a heavy ball and even when I hit it, I felt like I hit a rock.” (Neyer / James.)
Thanks to North Korea’s decision to invade South Korea in the summer of 1950, Simmons was forced to sign up with a National Guard unit to avoid being drafted by the Army. Unfortunately for Simmons, his National Guard unit was called up in mid-September. The effect Simmons absence on the Phillies roster was immediate. Down the stretch the Phillies saw their six-game lead evaporate as their pitching staff grew perilously thin. Roberts actually had to start three of the Phillies final five games of the season and was so worn down from the dramatic victory over the Dodgers on October 1, that he was unable to start Game One of the World Series. As you’ll see in a future installment of this series, the Phillies defeat in the 1950 World Series was due to a lack of offense instead of a lack of quality pitching, but Simmons absence in the Series impacted the team.
Simmons remained in uniform in 1951, missing the entire season. A crucial reason for why the 1951 Phillies fell short to the Giants and Dodgers was Simmons absence: the decline in Jim Konstanty’s performance, the decline in Del Ennis’ performance and the overall slip in the quality of the Phillies offense put more pressure on a pitching staff that was suddenly much, much thinner than it had been.
Simmons returned in 1952 and had probably his best season as a Phillie:
1952:
HR/9: 0.49
BB/9: 3.13
K/9: 6.31
ERA: 2.82
FIP ERA: 2.84
W-L: 14-8
WHIP: 1.19
1952 was also probably Robin Roberts finest season as a pitcher: 28-7, 2.59 ERA (2.86 FIP). With Simmons back the Phillies once more had the best pitching staff in the majors, with a team ERA of just 3.07, nearly a half run better than the second-place Dodgers at 3.53. Unfortunately the Phillies finished in fourth place, nine and a half games behind the Dodgers thanks to the Dodgers fearsome offense, which the lighter-hitting Phillies could not match.
The ’52 campaign was a major triumph for Simmons: he started the 1952 All-Star Game at Shibe Park in Philadelphia. It was the third straight year a Phillie had done so (Roberts started in ’50 & ’51), and it would be the first of Simmons two All-Star Game starts.
Simmons got off to another great start in 1953, pitching a one-hitter against the Boston Braves where he got 27 consecutive batters out after allowing a lead-off single. Unfortunately, Simmons suffered a freak injury in 1953 when he accidentally ran over his foot with his lawn mower and injured in big toe. As in 1950, as in 1952, Curt Simmons wouldn’t reach the magical number of twenty wins in 1953. He finished strong, but it wasn’t quite on par with ’50 and ’52:
1953:
HR/9: 0.65
BB/9: 3.10
K/9: 5.22
ERA: 3.21
FIP ERA: 3.49
W-L: 16-13
WHIP: 1.24
Simmons turned in another good performance in 1954, going 14-15 with a 2.81 ERA, his career low ERA. Despite his impressive performance – nonwithstanding the mirage of his win-loss record – Simmons didn’t make the ’54 All-Star roster. Simmons struggled in 1955, going just 8-8, before returning to his old form in 1956 with a 15-10 record. Here are Simmons stats for those seasons:
1954 / 1955 / 1956
FIP: 3.37 / 4.14 / 3.50
ERA: 2.81 / 4.92 / 3.36
HR/9: 0.53 / 1.04 / 0.78
BB/9: 3.49 / 3.47 / 2.96
K/9: 4.45 / 4.02 / 4.00
WHIP: 1.28 / 1.53 / 1.27
W-L: 14-15 / 8-8 / 15-10
In 1957 Simmons returned with the finest season he had since ’52. Once more Simmons started in the All-Star Game, the seventh time in eight years that a Phillie pitcher had started. Unfortunately, the ’57 Phillies just weren’t very good, scoring the second-fewest runs in the N.L. that season. Roberts went 10-22. Despite Simmons great season, the Phillies went 77-77 and finished eighteen games behind the first-place Milwaukee Braves. Here are Curt’s stats:
1957:
HR/9: 0.47
BB/9: 2.13
K/9: 3.91
ERA: 3.44
FIP ERA: 3.09
W-L: 12-11
WHIP: 1.25
What struck me as interesting was that Curt was more of a strikeout artist throughout his career, especially in contrast to Roberts, a control pitcher who was more apt at not surrendering walks than getting strikeouts. ’57 was a major change for him: it was, by far, the lowest walks per nine innings pitched he surrendered in his career. It was also the fewest strikeouts he had gotten per nine innings in his career. Compare his walks and strikeouts in 1950, 1952 and 1957:
1950 / 1952 / 1957
BB/9: 3.68 / 3.13 / 2.13
K/9: 6.11 / 6.31 / 3.91
Those are startling changes. He was becoming a different pitcher. Unfortunately, 1957 was pretty much the end of the line for Curt Simmons as a Phillie. In 1958 he went 7-14 with a 4.38 ERA which was much worse than his 3.20 FIP ERA. Simmons hurled just ten innings in 1959 and was released by the team in 1960, whereupon the St. Louis Cardinals wisely snapped him up. Simmons suddenly became an anchor on a very strong Cardinals team. In 1964 Simmons turned in his finest performance since 1957, going 18-9 (a career high in wins) with a 3.43 ERA. A look at Simmons stats from that season shows how he morphed from being a flamethrower to a Robin Roberts-like control pitcher:
HR/9: 0.89
BB/9: 1.80
K/9: 3.84
Simmons enabled the Cardinals to sweep up from behind the Phillies and stun the ’64 Phils by coming from six and a half games back on September 20, 1964, to win the pennant. On September 30, 1964, Simmons defeated Jim Bunning 8-5 at Busch Stadium, scattering five hits over eight innings, striking out two Phillies and not allowing a walk, in a masterful game that ran the Phillies losing streak to ten games and effectively ended their season and completed one of the darkest moments in Phillies history. It was the Cards eighth consecutive victory. Simmons started games three and six for the Cardinals, both defeats, although Simmons wasn’t the losing pitcher in their 2-1 loss in Game Three when Mickey Mantle drove a Barney Schultz knuckleball out of the field for a home run in the bottom of the ninth. After being denied an opportunity to play in the ’50 World Series, '64 was Simmons sole taste of post-season glory.
Simmons left the Cards during the ’66 season and briefly pitched for the Chicago Cubs, alongside his old Phillies teammate, Robin Roberts. The 1967 season was his last. Simmons retired that season.
In the final analysis I think a few things are noteworthy about the life and career of Curt Simmons: he was a very integral part of those teams that the Phillies fielded in the 1950s that came close to the edge of competing yet consistently fell short. He’d probably be more remembered in the history of Philly sports if he had won twenty games, something he never did and Roberts did six consecutive seasons from 1950 to 1955. Curt Simmons deserves to be remembered as a dominant pitcher and a big part of Phillies baseball in the 1950s. It is too bad that the Korean War interfered with his season in 1950, because he almost certainly would have won twenty games that season, and might have won twenty and helped the Phillies compete in 1951 as well.
It is a sad, "what-if" of history. Good work, Curt.
Previous Installments of the Wiz Kids:
Part V: Robin Roberts.
Part IV: The first half of the 1950 season.
Part III: Jim Konstanty.
Part II: Eddie Sawyer.
Part I: The Path to 1950.
Prolouge.
Tuesday, October 24, 2006
Jamie Moyer, the World Series, MNF
The Phillies re-signed pitcher Jamie Moyer to a two-year deal worth $10.5 million yesterday, the Phillies first move for this off-season. While I like Jamie Moyer and I like what he brought to the Phillies in 2006, I am not sure that I care for the deal: the Phillies were able to pare $15 million off the club payroll for 2007 by dealing Bobby Abreu, so turning around spending a third of that on a pitcher who will be 44 on Opening Day next season strikes me as being a waste of resources at a time when the team needs a new third baseman.
Confused about what I’m talking about? Here are the stats I refer to defined:
ERA – Earned Run Average: (Earned Runs * 9) / IP = ERA
FIP – Fielding Independent Pitching: (13*HR+3*BB-2*K / IP) + League Factor Evaluates a pitching by how he would have done with an average defense behind him by keeping track of things that a pitcher can control (walks, strikeouts, home runs allowed) as opposed to things he cannot (hits allowed, runs allowed).
DER – Defense Efficiency Ratio: (Batters Faced – (Hits + Walks + Hit By Pitch + Strikeouts)) / (Batters Faced – (Home Runs, Walks + Hit By Pitch + Strikeouts)) How often fielders convert balls put into play into outs.
Hr/9 – Home Runs allowed per nine innings: (HR * 9) / IP
BB/9 – Walks per nine innings: (BB * 9) / IP
Okay, Jamie Moyer is a durable pitcher (sixth consecutive season with 200+ innings, eighth of last nine with 200+ as well), and he has a terrific attitude. He brought a culture of winning to the Phillies dugout that was sorely lacking in positives. However, I don’t think he pitched that well in 2006. Moyer went 5-2 with a 4.03 ERA with the Phillies. Yes, I am very impressed by his 1.3 BB/9 rate. However, I’d note that he also surrendered a fair number of home runs (1.49 HR/9), and his FIP ERA was sixty-three points higher than his regular ERA at 4.64 … Moyer was able to do what he did for the Phillies thanks to great fielding from the Phillies defense. Despite surrendering a high 23.1% of line-drives with balls put into play, the Phillies D converted .753 of those balls put into play into outs. A high line-drive percentage vs. a high DER. One of these two cannot stand in 2007, and I think it will be the latter. Jamie Moyer is a lot like Jon Lieber, a pitcher who I expected to thrive with the Phillies and he never did. I just don’t see Jamie Moyer as being worth the money. Especially when you have so many needs: third base, bullpen, etc.
As for the World Series, it is all tied up at one game each. While I am rooting for the Tigers, I am not rooting for Kenny Rogers, a player that I think is a jerk, and my belief in his bad character was strengthened by this dirt issue from Game two. Was Rogers cheating? I personally suspect so: how didn’t he notice dirt on his pitching hand?
The next three games are in St. Louis, which I don’t like: why does the MLB schedule game five for the other teams town? If home field advantage exists, then send the team with that advantage to its town to play game five. I think it gives the road team in the series a slight advantage playing game five in their park.
I still think the Tigers will win the series, but I am revising my prediction to six games instead of five. The key will be the Tigers pitchers and how well they shut-down the Cardinals batters. I guess we’ll see tonight.
If someone had to win last night’s Monday Night Football game, I guess it was better for the Giants to do so. They are the more beatable team, in my opinion, and it was fun to see T.O. suffer, waving his arms and sulking in frustration. I am sort of impressed by the performance of the Giants D, but then the Eagles gave them a great blueprint from a few weeks ago and they did their work against two QBs: one who has never been mobile in his entire career, and the other is a fresh-faced rookie. I expect to see Tony Romo as the ‘Boys QB for the rest of the season. I think Bledsoe’s career is finished. So the good news for the Birds is that the ‘Boys still trail them at 3-3 to the Eagles 4-3, the bad news is that the Giants are 4-2 and sit in first. Hmmm … that week two loss might just loom very, very big in the grand scheme of things at the end of the season. I guess we’ll see.
Tomorrow, Part VI of the Wiz Kids, a focus on Curt Simmons.
Previous Installments of the Wiz Kids:
Part V: Robin Roberts.
Part IV: The first half of the 1950 season.
Part III: Jim Konstanty.
Part II: Eddie Sawyer.
Part I: The Path to 1950.
Prolouge.
(0) comments
Confused about what I’m talking about? Here are the stats I refer to defined:
ERA – Earned Run Average: (Earned Runs * 9) / IP = ERA
FIP – Fielding Independent Pitching: (13*HR+3*BB-2*K / IP) + League Factor Evaluates a pitching by how he would have done with an average defense behind him by keeping track of things that a pitcher can control (walks, strikeouts, home runs allowed) as opposed to things he cannot (hits allowed, runs allowed).
DER – Defense Efficiency Ratio: (Batters Faced – (Hits + Walks + Hit By Pitch + Strikeouts)) / (Batters Faced – (Home Runs, Walks + Hit By Pitch + Strikeouts)) How often fielders convert balls put into play into outs.
Hr/9 – Home Runs allowed per nine innings: (HR * 9) / IP
BB/9 – Walks per nine innings: (BB * 9) / IP
Okay, Jamie Moyer is a durable pitcher (sixth consecutive season with 200+ innings, eighth of last nine with 200+ as well), and he has a terrific attitude. He brought a culture of winning to the Phillies dugout that was sorely lacking in positives. However, I don’t think he pitched that well in 2006. Moyer went 5-2 with a 4.03 ERA with the Phillies. Yes, I am very impressed by his 1.3 BB/9 rate. However, I’d note that he also surrendered a fair number of home runs (1.49 HR/9), and his FIP ERA was sixty-three points higher than his regular ERA at 4.64 … Moyer was able to do what he did for the Phillies thanks to great fielding from the Phillies defense. Despite surrendering a high 23.1% of line-drives with balls put into play, the Phillies D converted .753 of those balls put into play into outs. A high line-drive percentage vs. a high DER. One of these two cannot stand in 2007, and I think it will be the latter. Jamie Moyer is a lot like Jon Lieber, a pitcher who I expected to thrive with the Phillies and he never did. I just don’t see Jamie Moyer as being worth the money. Especially when you have so many needs: third base, bullpen, etc.
As for the World Series, it is all tied up at one game each. While I am rooting for the Tigers, I am not rooting for Kenny Rogers, a player that I think is a jerk, and my belief in his bad character was strengthened by this dirt issue from Game two. Was Rogers cheating? I personally suspect so: how didn’t he notice dirt on his pitching hand?
The next three games are in St. Louis, which I don’t like: why does the MLB schedule game five for the other teams town? If home field advantage exists, then send the team with that advantage to its town to play game five. I think it gives the road team in the series a slight advantage playing game five in their park.
I still think the Tigers will win the series, but I am revising my prediction to six games instead of five. The key will be the Tigers pitchers and how well they shut-down the Cardinals batters. I guess we’ll see tonight.
If someone had to win last night’s Monday Night Football game, I guess it was better for the Giants to do so. They are the more beatable team, in my opinion, and it was fun to see T.O. suffer, waving his arms and sulking in frustration. I am sort of impressed by the performance of the Giants D, but then the Eagles gave them a great blueprint from a few weeks ago and they did their work against two QBs: one who has never been mobile in his entire career, and the other is a fresh-faced rookie. I expect to see Tony Romo as the ‘Boys QB for the rest of the season. I think Bledsoe’s career is finished. So the good news for the Birds is that the ‘Boys still trail them at 3-3 to the Eagles 4-3, the bad news is that the Giants are 4-2 and sit in first. Hmmm … that week two loss might just loom very, very big in the grand scheme of things at the end of the season. I guess we’ll see.
Tomorrow, Part VI of the Wiz Kids, a focus on Curt Simmons.
Previous Installments of the Wiz Kids:
Part V: Robin Roberts.
Part IV: The first half of the 1950 season.
Part III: Jim Konstanty.
Part II: Eddie Sawyer.
Part I: The Path to 1950.
Prolouge.
Monday, October 23, 2006
The Wiz Kids, Part V: Focus on Robin Roberts
When I went to Steve Carlton Night in 1989 I remembered looking out into the outfield of the Vet and seeing Carlton’s #32 joined with two other numbers, Richie Ashburn’s #1 and Robin Roberts #36. At the age of 12, I knew that Richie Ashburn was the Phillies broadcaster and a great player in his own right, but I was baffled: who was this Robin Roberts guy? Never heard of him.
Since I began doing some reading into the Phillies history I’ve discovered what an exceptional player Roberts was, but I am utterly stunned that Robin Roberts isn’t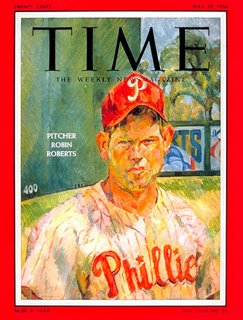 more remembered for his achievements by both Phillies fans and the baseball community at large. For being a Hall of Fame inductee – in fact, Roberts is the Phillies first Hall of Famer – he is curiously uncelebrated for his achievements with the Phillies and is largely unknown to most fans. One of the things that I am hopeful for with this series of posts is to shed more historical light on Robin Roberts. He deserves to be honored and remembered for being not only one of the greatest Phillies of all-time but perhaps the greatest pitcher the Phillies have ever had, even considering Steve Carlton. Robin Roberts was a giant in the history of the Phillies and it is time he gets his due.
Simply put, Robin Roberts was the best pitcher in baseball during the 1950s. From 1950-1956 he was an All-Star each year and placed in the top ten of the MVP voting five times, in 1950 and between 1952 and 1955. He led the N.L. in innings pitched from 1951 to 1955, led the NL in victories between 1952 and 1955, and had the best walk-to-strikeout ratio of an NL pitcher from 1952 to 1954, and again in 1956 and 1959. He also surrendered the fewest walks per nine innings pitched from 1952 to 1954 and in 1956. He started the All-Star Game for the NL five times (1950-1951, 1953-1955). He was the most dominant pitcher of his era.
Let me start off by saying that I am going to be using a lot of stats in this article. If you are confused about what I’m talking about, then here are the stats I refer to defined:
WHIP – Walks plus hits by innings pitched: (BB + H) / IP = WHIP
ERA – Earned Run Average: (Earned Runs * 9) / IP = ERA
FIP – Fielding Independent Pitching: (13*HR+3*BB-2*K / IP) + League Factor Evaluates a pitching by how he would have done with an average defense behind him by keeping track of things that a pitcher can control (walks, strikeouts, home runs allowed) as opposed to things he cannot (hits allowed, runs allowed).
DER – Defense Efficiency Ratio: (Batters Faced – (Hits + Walks + Hit By Pitch + Strikeouts)) / (Batters Faced – (Home Runs, Walks + Hit By Pitch + Strikeouts)) How often fielders convert balls put into play into outs.
HR/9 – Home Runs allowed per nine innings: (HR * 9) / IP
K/9 – Strikeouts per nine innings: (K * 9) / IP
BB/9 – Walks per nine innings: (BB * 9) / IP
Roberts career began in Michigan after his discharge from the Army Air Force in 1945. A talented athlete, he played basketball on a scholarship and a little baseball at Michigan State. After playing independent league ball in 1947, Roberts was signed to a deal with the Phillies and joined the minor league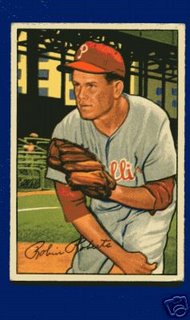 team in Wilmington, Delaware in 1948 where he made short work of the opposition. The Phillies sent him up to Philadelphia at the age of 22. Roberts remembered that he traveled from Hagerstown, Maryland, where his team was playing a game to Wilmington and then up to Philadelphia to Shibe Park where he was approached by then-manager Ben Chapman when he arrived at 6:00 P.M. After Chapman asked Roberts how he felt, he simply informed that he was making his major league debut in two hours against the Pittsburgh Pirates. Roberts lost, but allowed just five hits.
His first season with the Phillies was a triumph: he went 7-9 with a 3.19 ERA. It was a very successful debut. He was still developing his skills and his control wasn’t quite there, as he walked 3.74 batters per nine innings that season. In 1949 Roberts established himself as the team’s ace, going 15-15 with a 3.69 ERA. Here are some of his stats from that season, showing the strides that he was making as a pitcher:
HR/9: 0.60
BB/9: 2.98
K/9: 3.77
WHIP: 1.34
FIP ERA: 3.59
Generally, a trend emerges from the 1949 season that will stay with Roberts throughout his career. He doesn’t get many strikeouts, but he’s pretty good about surrendering home runs and he’s stingy with the walks allowed. Remembered one umpire who worked the National League in the ‘50s: “Roberts was a great pitcher. He was an umpire’s delight to work the plate with because he had uncanny control. The ball was always in or near the strike zone, and he had the players swinging at the ball all of the time. They weren’t waiting for bases on balls because Roberts didn’t give up bases on balls or very few of them.” (Page 360, Neyer/James Guide to Pitchers quoting Jocko.) Roberts is also durable in 1949, throwing 226 and two-thirds of an inning. Part of that was Roberts delivery towards home plate. According to Eddie Sawyer, Roberts manager: “[Roberts] had a very easy delivery. I call it symmetry of motion. It just flowed, pitch after pitch. He made it look easy.” (Page 360, Neyer/James Guide to Pitchers, quoting The Man in the Dugout.)
The Golden Era: 1950 – 1955
Roberts best seasons were between 1950 and 1955, six years where the Phillies, to varying degrees, were in contention for the National League pennant. In his Historical Baseball Abstract, Bill James ranked Robin Roberts has the sixteenth best pitcher of all-time, noting that between 1950 and 1955 Roberts led all pitchers in Win Shares, with the exception of 1951, where the Giants Sal Maglie narrowly bested him 27.75 to 27.71. In discussing Roberts remarkable achievements, James noted that Roberts probably never received the credit he was due in history because he never won the Cy Young Award, in part because the Cy Young Award was created in 1956, just when Roberts exceptional period of dominance came to an end. During that time Roberts was named The Sporting News pitcher of the year three times, so he likely would have won the Cy Young those seasons.
Roberts run, appropriately, kicks off with the Wiz Kids.
In 1950 Roberts has his first truly great statistical season, going 20-11 with a 3.02 ERA. Take a closer look at his numbers:
HR/9: 0.86
BB/9: 2.27
K/9: 4.32
WHIP: 1.17
FIP ERA: 3.55
At first glance, Roberts did surrender a lot of home runs – 29 – but that was largely a product of facing the second-highest number of batters in the NL that season: 1,228. Despite throwing as many innings as he did Roberts still did better than the NL averages for home runs allowed (0.89), walks (3.71) and strikeouts (4.09).
Roberts faced a lot of stress in 1950. After Curt Simmons, who went 17-8 with a 3.40 ERA that season, joined the National Guard following the outbreak of the Korean War, Roberts was carrying the Phillies for part of their run for the pennant and for nearly all of September. After Simmons and Jim Konstanty, the quality of the Phillies pitching staff fell off dramatically, leaving Roberts and Konstanty largely carrying the team to the pennant. In late July, for example, Roberts hurled three consecutive shutouts, keeping the opposition scoreless for thirty-two and two-thirds innings. Down the stretch, with the Phillies offense struggling to score runs, it was Roberts masterful pitching that kept the Phillies in the hunt for the playoffs.
On October 1, 1950, Roberts pitched one of the most important games in Phillies history. (See, Part XII of this series.) Leading the Brooklyn Dodgers by a game on the last day of the season the Phillies needed to win to avoid a playoff against the Dodgers for the pennant. The Phillies were reeling, having lost their last five games, including a 7-3 loss to the Dodgers the day prior. If they didn’t win, the Dodgers would have the edge in the playoff and the Phillies would have blown an insurmountable lead for the pennant.
Roberts blanked the Dodgers, the best offensive team in the National League, nearly all game long, surrendering a fluke home run to Pee Wee Reese in the sixth inning. In the bottom of the ninth the Dodgers nearly won the game when Duke Snider singled to centerfield and the Dodgers waved Cal Abrams home to score the winning run. Richie Ashburn snared Snider’s hit and hurled the ball to home plate to gun Abrams out. After Roberts survived the rest of the ninth, Dick Sisler hit a three run home run at the top of the tenth inning to give the Phillies a 4-1 lead. Roberts retired the side at the bottom of the tenth inning, despite having gotten lime into his eyes during the top of the tenth when he slid into third base. Ashburn was the hero, Sisler got the big hit, but it was Roberts clutch pitching which shut down the most dangerous team in the National League, holding them to a single run on five hits and three walks in ten innings of work. Roberts performance that day is even more impressive when you consider it was the third start he had worked in five days.
Without Roberts masterful pitching there would have been no tie game, there would have been no throw by Ashburn, there would have been no home run by Sisler and no pennant for the Wiz Kids.
Too tired to pitch Game One of the World Series, Roberts pitched in Game Two, four days after the climatic 4-1 win over the Dodgers. Roberts again hurled ten innings, surrendering ten hits and three walks. Roberts got just one run in support from the Phillies hitters, a sac fly from Ashburn to even the game at 1-1 in the fifth inning. Tied at 1-1, Roberts finally cracked in the top of the tenth inning, surrendering a lead-off home run to Joe DiMaggio, the only home run DiMaggio hit in the series. The Yankees won 2-1. Two days later the Yankees closed out the sweep of the Wiz Kids with a 5-2 victory at Yankee Stadium. Roberts hurled the eighth inning of the game, pressed into service to keep the Phillies faint hopes to win alive.
In 1951 the Wiz Kids stunned the baseball world and Philadelphia fans by going just 73-81, finishing twenty-three games out of first place. Memories of the Wiz Kids dramatic pennant were erased by the Giants climatic comeback and the Dynasty That Was To Be was nevermore. Nearly every player on the Phillies roster slumped that season. Despite the fact that the Phillies team DER dropped from second to fourth and their team ERA dropped from first to fourth, Roberts came back in 1951 with the same dominance. In a grim season, Roberts was a ray of hope for the future.
Roberts went 21-15 with a 3.03 ERA in 1951. A closer look at his stats gives you an idea about how dominant he was that season:
HR/9: 0.57
BB/9: 1.83
K/9: 3.63
WHIP: 1.10
FIP ERA: 3.07
The 1951 season represents a bit of a turning point for Roberts. His walks continued to drop, the home runs dropped as well and he became even tougher to get a hit off of. It was Roberts first season to lead the National League in innings pitched as well. Once more he was second in batters faced. All of this playing for a team that had difficulty supplying him with runs even when they were playing well. The ’51 Phillies were sixth in the NL in runs scored, down from fourth in ’50. The ’51 Phils scored seventy-four fewer runs than the ’50 team did, so wins were far harder to come by.
The transition to ace pitcher was complete:
1949 1950 1951
HR/9: 0.60 0.86 0.57
BB/9: 2.98 2.27 1.83
K/9: 3.77 4.32 3.63
WHIP: 1.34 1.17 1.10
FIP ERA: 3.59 3.55 3.07
But the ’51 campaign was a massive failure for the Phillies. They fought to finish fifth and left fans anticipating another pennant bitterly disappointed. Eddie Sawyer’s days as manager were numbered. He was gone in ’52, as the Phillies climbed back to respectability. To help Roberts, Curt Simmons returned from the Army and was spectacular in 1952, going 14-8 with a 2.82 ERA*, but the Phillies offense was still much worse than the rest of the NL, and the Phillies defense was just fifth in the NL in DER.
The 1952 Phillies got off to a lousy start, fired Eddie Sawyer and promptly rolled off 59 wins in their last 91 games (.648), going from sixth place and seventeen and a half games out of first place to fourth place, just nine and a half games out. The ’52 Phils hot finish convinced many that the Return of the Wiz Kids were right around the corner.
* Earlier I noted that Roberts started the All-Star Game for the NL every season between 1950 and 1955 save one, 1952. Simmons started the ’52 All-Star Game for the NL. A Phillies pitcher started the All-Star Game every year from 1950 to 1955 (and then Curt Simmons started the '57 game). That was how dominant the Phillies pitching was in the ‘50s.
The ’52 season was also Roberts greatest. He went 28-7 with a 2.59 ERA that season and thoroughly dominated the National League. A major factor in Roberts success was his decision to adopt the Giants Sal Maglie’s “hard curve” that season to replace his own slow curve which he felt didn’t work. (Neyer / James Guide to Pitchers, page 360, quoting My Life in Baseball.) Here is a closer look at those numbers:
HR/9: 0.60
BB/9: 1.22
K/9: 4.03
WHIP: 1.02
FIP ERA: 2.86
Roberts dominance that season was scary. Roberts obliterated the NL averages that season for home runs (0.74), walks (3.39) and WHIP (1.34). Roberts finished under the league average for strikeouts (4.28), but his control of the strike-zone and ability to get the opposition to put weak hits into play were the reasons why he was so special.
That season he led the National League in wins with twenty-eight, a whopping ten more than the Giants Maglie; had the best strikeout-to-walk ratio in the N.L., 3.29, much better than the Cubs Warren Hacker at 2.71; allowed the fewest walks per nine innings, 0.29 better than Hacker; faced the most batters, 1,310, 120 more than the Braves Warren Spahn; threw the most innings, 330, forty more than Spahn, started the most games, 37, two more than Spahn; and threw the most complete games, 30, nine more than the Pirates Murry Dickson. He finished second in WHIP to Hacker (0.946), and third in ERA, behind Hacker (2.58) and the Giants Hoyt Wilhelm (2.43). Stunningly, Roberts completed his final twenty-eight starts in 1952. Think about that in our age of five, six, seven inning starts: Robin Roberts went the distance twenty-eight consecutive times in 1952.
Roberts and Simmons were the one-two punch that the Phillies had dearly lacked in 1951 and were a major reason why the team once more had the best ERA in the N.L. Roberts ability to control the strike-zone is a major reason why the Phillies averaged nearly a walk fewer per nine innings than any other National League team (2.4, better than the Cardinals 3.3). Roberts was so good in 1952 that he actually finished second in the MVP voting to the Cubs Hank Sauer, getting 211 votes to Sauer’s 226. I would never expect to see a pitcher factor much in the MVP voting today, and I can’t fathom that one would nearly beat a position player for the award in the 1950s, an era that valued hitting over pitching. (Though teammate Jim Konstanty did just that in 1950.)
The next season Roberts ran his consecutive complete games streak to thirty-three on his way to a 23-16 record with a 2.75 ERA. The ’53 Phillies played well, but couldn’t survive an injury to Curt Simmons and watched as the Brooklyn Dodgers won the pennant in a walk. The ’53 team won 83 games but the Dodger went 105-49 and buried the Phillies twenty-two games out of first. Still, it was another great season for Roberts:
HR/9: 0.78
BB/9: 1.58
K/9: 5.14
WHIP: 1.11
FIP ERA: 3.20
He finished tied for first in wins with Warren Spahn, first in strikeouts (the first time he led the National League in this category), first in walks per nine innings, first in games started with 41, first in complete games with 33 (nine more than Spahn), first in innings pitched with 346 & 2/3 (eighty-one more than Spahn), first in batters faced with 1,422 (a whopping 357 more than Spahn) and first in strikeout-to-walk ratio at 3.25, 0.89 better than the Cardinals Harvey Haddix. Roberts had the second-best WHIP (best: Spahn at 1.058) and the second-best ERA (best: Spahn at 2.10). Warren Spahn might have posted impressive stats, but he did so on a team that provided him with plenty of run support and he threw many fewer innings – eighty-one fewer to be exact – than Roberts.
Once more Roberts was in the thick of the MVP voting, finishing sixth. The run-away winner of the MVP award that season was the Dodgers Campanella, who got 297 of the maximum 336 votes.
The 1954 was the continuation of a familiar pattern for Roberts as a Phillie. The team had promise but would falter badly, while he would be left to try to keep the Phillies in the mix. The Phillies pitching staff was the third-best in the majors that season, allowing just a 3.59 ERA, almost exclusively a product of Roberts sterling pitching. The problem was that their offense couldn’t generate enough runs to convert Roberts good starts into victories. In 1953 Roberts was the losing pitcher in 16 games. He’d lose another 15 in 1954. Roberts did win 23 games in 1954, the fifth consecutive season he won twenty or more games.
Roberts was again spectacular for the Phillies:
HR/9: 0.94
BB/9: 1.50
K/9: 4.95
WHIP: 1.02
FIP ERA: 3.23
He led the National League in wins, strikeouts, complete games, games started, WHIP, walks allowed per nine innings, strikeout-to-walk ratio, innings pitched and batters faced. He finished sixth in ERA. During the ’54 campaign Roberts tossed a pair of one-hitters and went fifteen innings to win a game 3-2 against the St. Louis Cardinals on June 17th, 1954. Roberts finished seventh in the MVP voting that season.
The 1955 season was marked a bit of a turning point for Roberts. Between 1951 and 1954 his FIP ERA had been 3.07, 2.86, 3.20 and 3.23. Now it would climb somewhat, to 3.59, the highest it had been since 1949. He still pitched well in 1955, but it was the end of his dominating period over the National League. It was also the last time that he would start the All-Star Game for the National League, and the last time he would win twenty or more games, which he had done six consecutive seasons. Roberts went 23-14 with a 3.28 ERA that season.
HR/9: 1.21
BB/9: 1.56
K/9: 4.72
WHIP: 1.13
FIP ERA: 3.59
Roberts still led the National League in wins, innings, batters faced, complete games and games started, but he finished second in walks allowed per nine innings, WHIP, strikeouts, and strikeout-to-walk ratio to the Dodgers Don Newcombe. Roberts also finished fifth in ERA. Once more the Phillies disappointed, losing 21 of their first 31 games. On May 18th, they were already fourteen games behind the Brooklyn Dodgers. Their season was finished, despite winning forty of their last sixty-nine games. They finished twenty-one and a half games out of the pennant race. 1955 also represented the end of the Phillies period of success during the 1950s. Despite disappointing fans by not returning to the World Series during the early 1950s, the Phillies had generally been in the mix and had finished fourth each season thanks to their strong pitching staff, which had been one of the best consistently each season.
So how does Roberts run of dominance look to us, some fifty years later? Utterly astonishing. Just compare Roberts walk rate to that of his contemporaries:
BB/9: Roberts / League / Diff.
1950: 2.27 / 3.75 / 1.48
1951: 1.83 / 3.57 / 1.74
1952: 1.22 / 3.45 / 2.23
1953: 1.58 / 3.52 / 1.94
1954: 1.50 / 3.67 / 2.17
1955: 1.56 / 3.53 / 1.97
Aside from 1950 and 1951, every season Roberts was twice as good as what the rest of the league was doing. Take the ’52 season: Roberts allowed just 45 walks in 330 innings of work, or 1.22 per nine innings. The rest of the National League allowed 3.45, nearly three times as many as Roberts. Roberts was simply in his own world. Nobody could touch him. Nobody, in this era, the 1950s, where the walk to strikeout ratio was somewhere near 1-to-1 … well, specifically between 1950 and 1955 there were 25,920 walks and 30,805 strikeouts in the National League, meaning there were 1.19 strikeouts to walks … could do what Robin Roberts was doing. He was so stingy with the walks that his good-to-average strikeout numbers still gave him a 2.71 to 1 strikeout-to-walk ratio. That’s better than twice as good as what the rest of the league was doing. Oh, and Roberts hurled so many innings during this time that when you delete his numbers from the rest of the National League, the N.L.’s overall K/BB ratio falls to 1.17. A single player made a significant change to the league’s stats.
In his Historical Abstract, Bill James named Robin Roberts the best pitcher in baseball during the 1950s four times: 1950, 1953, 1954 and 1955 (interestingly, not awarding Roberts with the top spot for his best statistical season, 1952). Here is an overview of those stats for the 1950s:
W-L ERA WHIP
1950: 20-11 3.02 1.18
1951: 21-15 3.03 1.10
1952: 28-7 2.59 1.02
1953: 23-16 2.75 1.11
1954: 23-15 2.97 1.02
1955: 23-14 3.28 1.13
HR/9 BB/9 K/9
1950: 0.86 2.27 4.32
1951: 0.57 1.83 3.63
1952: 0.60 1.22 4.03
1953: 0.78 1.58 5.14
1954: 0.94 1.50 4.95
1955: 1.21 1.56 4.72
I really only think that there is one other pitcher who had the kind of impact on his era like Robin Roberts: Sandy Koufax. The comparison isn’t perfect – Koufax was a strikeout artist, Roberts wasn’t – but they were both dominant in their leagues during their times. What interests me about the comparison between Roberts and Koufax is that Roberts accomplished his remarkable feats during the era of offense, when teams scored runs in bushels. Koufax was the most dominant pitcher in an era where pitchers held all of the cards. For example, Koufax allowed just 1.68 walks per nine innings in 1963. The league average that season was lower than it had been in the 1950s: 2.82. While Koufax was doing remarkable things during the 1960s, Roberts was a statistical anomaly, a pitcher who was dominant in an era where the batters held the cards. In 1963 there were 2.09 strikeouts to walks. In 1964 the K/BB ratio was 2.10 to 1. In 1965 it was 2.03 to 1. Koufax was a remarkable pitcher, but he must be considered in his context. He was getting a lot of strikeouts and keeping guys from getting walks, but he did so in an era where pitchers were starting to dominate. Roberts has to be evaluated in his context as well: his stats contrast well with Koufax and he did that in a offense-friendly era.
In addition to comparing their performances on the mound in their respective periods, I also think it is interesting to compare Sandy Koufax’s temperament to Roberts. Both had reputations for being calm, polite players who won the respect of their peers because they didn’t engage in absurd posturing or loud, obnoxious behavior. T.O. could have learned from both of these guys. Roberts himself said: “I was mainly a one-pitch pitcher, although sometimes I mixed in a curveball when I was ahead in the count. I could put my fastball where I wanted it, but I was sometimes criticized for not pitching inside more and not knocking hitters down … Well, lots of people talked about knocking batters down but few did it. And it just wasn’t me. I just went after people with my best stuff and let the batters hit it if they could. That was my act, and it got me through eighteen years in the big leagues.” Neyer / James Guides to Pitchers, page 360, quoting My Life in Baseball by Robin Roberts.) Said Eddie Sawyer: “[Roberts] would never throw at hitters. They knew this and would go up there and take a toehold, but he would still get them out. He did it with speed, control and stamina.” (Neyer / James Guides to Pitchers, page 360, quoting The Man in the Dugout.) Koufax and Roberts both conducted themselves with grace and dignity, traits that modern players seem to hold in short supply.
Koufax, who retired from baseball following the 1966 World Series at roughly the same time as Roberts (1967), got into the Hall of Fame quickly, whereas Roberts was forced to wait a few years before being elected. Underrated, undervalued by history, Roberts remarkable run has gone largely unremembered. This was a pitcher every bit as good as Sandy Koufax, but who had the misfortune to toil on a team that was not in New York or Los Angeles, and who never won the World Series as Koufax did in 1963 and 1965. Ken Burns Baseball series spent considerable time on Koufax and the ’60s Dodgers (actually they spent loads of time on the Dodgers regardless of the era), but to my recollection Robin Roberts and the Wiz Kids rated nary a mention.
Bill James argued in his Historical Baseball Abstract that Koufax deserves special recognition beyond simply being a great pitcher for being THE integral part of the Dodgers ’63, ’65 and ’66 pennant-winners, a factor to James that makes Koufax great beyond his raw numbers. I submit that Roberts tough performance in 1950 – pitching the decisive game of the season on three days rest after having started two games within the last five days, then allowing just one run in ten innings while pitching the climatic tenth with irritated, blurred vision – makes him THE integral part of the Wiz Kids run to the pennant. I think that Roberts deserves recognition for that and credit for being great beyond his statistics.
One little aside before I move onto Roberts final seasons with the Phillies – Roberts was, for a pitcher, a okay hitter. In 1955 he had a .360 OBP (he was 27-for-107 with eighteen walks), with two home runs, four triples, nine doubles, 13 RBIs, and 12 runs scored. His GPA that season was .279 and he had 18 Runs Created. His performance was a bit of an anomaly, but something to consider in evaluating his remarkable career.
Toiling in Obscurity: 1956 – 1961
Roberts run came to an end in 1955, but he still continued to be a dominant pitcher for some time. In 1956 the Phillies pitching was the worst in the National League. The decline in the quality of the Phillies pitching can be directly traced to Roberts struggles that season. Hampered by a leg injury, for the first time since 1949 he failed to win twenty games, going 19-18, losing his chance for a twentieth win on the final day of the season. Roberts also allowed 46 home runs that season, a major league record. His ERA jumped from 2.97 in ’54 to 3.28 in ’55 to 4.45 in ’56.
HR/9: 1.39
BB/9: 1.21
K/9: 4.75
WHIP: 1.24
FIP ERA: 3.65
While the decline in Roberts output seemed dramatic, it really wasn’t. His FIP barely inched up compared to what he did in ’55, and he actually did slightly better with walks and strikeouts that season. Roberts had been losing a lot of games for a while, a product of the fact that he was pitching so many of the Phillies innings and absorbing a lot of the losses in games where they couldn’t do any better than muster a run or two. Roberts simply gave up a few more home runs than he usually did in 1956, but the effect on his career was considerable.
Roberts finished just twenty-third in the MVP voting in 1956, with seven votes out of 336. He once more led the National League in walks allowed per nine innings, in strikeout-to-walk ratio, and in complete games. But 1956 marked the start of a new, more difficult time for Roberts.
In 1957 the Phillies were 77-77 and finished eighteen games out of first place. Roberts also had a difficult season, going 10-22 with a 4.07 ERA.
HR/9: 1.44
BB/9: 1.55
K/9: 4.61
WHIP: 1.56
FIP ERA: 4.15
The 1957 season seems a clear case where the Phillies anemic offense cost Roberts a number of games. Roberts pitched so many games with so many innings that he racked up many decisions and often lost games that might have gone to other pitchers. The twenty-two losses looked much worse than they were, but clearly he was back-sliding somewhat.
The following season, 1958, Roberts rebounded. That season he went 17-14 with a much-improved 3.24 ERA, his best since 1954. Statistically, Roberts turned in a terrific season:
HR/9: 1.00
BB/9: 1.70
K/9: 4.34
WHIP: 1.19
FIP ERA: 3.62
The problem for the Phillies was that they had cratered badly, dropping from 77-77 and fifth place to 69-85 eighth place, dead last in the N.L. It was the Phillies first dead-last finish since 1947. Despite the Phillies blunders Richie Ashburn had won the batting title and had his most productive season offensively. Roberts ranked on the leader boards as well, finishing third in WHIP, fourth in innings pitched and batters faced, second in complete games, and second in strikeouts-to-walk ratio and in walks allowed per nine innings. Surely the last Wiz Kids knew that the end was near.
1959 brought a second consecutive last-place finish for the Phillies. Many of the former Wiz Kids left at this juncture. Richie Ashburn slumped badly in ’59 and went to the Cubs after the season ended. Willie Jones and Granny Hammer retired. Roberts continued on, still amassing impressive stats. He went 15-17 that season with a 4.27 ERA, over a run higher than it had been in 1958, although I’d note that Roberts FIP ERA was relatively unchanged, which suggests that the problems might have been more with the (poor) quality of the Phillies defense than with Roberts. Notice that Ashburn had his worst season as a Phillie that year, a factor that strongly impacted the defense that surrounded Roberts on the field.
Roberts did his best, however. For the fifth and final time he led the N.L. in strikeout-to-walk ratio, and finished third in walks allowed per nine innings. He was thirty-two and it was his twelfth major league season:
‘59
HR/9: 1.18
BB/9: 1.22
K/9: 4.79
WHIP: 1.17
FIP ERA: 3.75
The 1950’s were over. It was a bitterly disappointing era for the Phillies: they had begun it by winning the N.L. pennant with a young team and never returned. Despite this, Roberts had a great decade.
On Opening Day, 1960, Robin Roberts and Curt Simmons were the sole Phillies left on the roster that played for the Wiz Kids. Simmons was released on May 17th and made his way to the St. Louis Cardinals, where he’d help win the 1964 World Series, and Roberts became the lone leftover from the ’50 team. He, once more, turned in a strong performance as, once more, the Phillies limped to an eighth place finish, trailing the Pirates that season by thirty-six games. Roberts went 12-16 with a 4.02 ERA. The decline in the quality of the fielders behind Roberts appears to be a major factor here as Roberts actual ERA climbed higher than his FIP:
‘60
HR/9: 1.17
BB/9: 1.29
K/9: 4.63
WHIP: 1.22
FIP ERA: 3.81
The 1961 season was an utter disaster for the Phillies. Between July 28 and August 20, 1961, the Phillies dropped twenty-three consecutive games. The team lost 107 games that season, a tough feat to accomplish in an era when they played just 154 games. Roberts clashed with abrasive manager Gene Mauch – who stated that season that Roberts threw “like Betsy Ross” and would led the Phillies into their epic collapse in 1964 – and struggled badly, having his worst statistical season ever, going 1-10 with a 5.85 ERA:
‘61
HR/9: 1.46
BB/9: 1.76
K/9: 4.15
WHIP: 1.51
FIP ERA: 4.51
It was the end of the road for Roberts with the Phillies. Since 1955 he had pitched well, but he couldn’t match that level of dominance he achieved from 1950 – 1955:
W-L ERA WHIP
1956: 19-18 4.45 1.24
1957: 10-22 4.07 1.16
1958: 17-14 3.24 1.19
1959: 15-17 4.27 1.17
1960: 12-16 4.02 1.22
1961: 1-10 5.86 1.51
HR/9 BB/9 K/9
1956: 1.39 1.21 4.75
1957: 1.44 1.55 4.61
1958: 1.00 1.70 4.34
1959: 1.18 1.22 4.79
1960: 1.17 1.29 4.63
1961: 1.46 1.76 4.15
To compare how dominant Roberts was during the earlier half of the 1950s, check out the differences between the two halves of the decade:
W – L ERA WHIP
1950 – 1955: 138-78 2.93 1.09
1956 – 1961: 74-97 4.16 1.22
The interesting thing is that, aside from Home Runs, Roberts actually posted somewhat better stats in the latter part of the decade:
HR/9 BB/9 K/9
1950 – 1955: 0.82 1.65 4.47
1956 – 1961: 1.26 1.42 4.58
This is utter speculation on my part, but I wonder if the Phillies decline in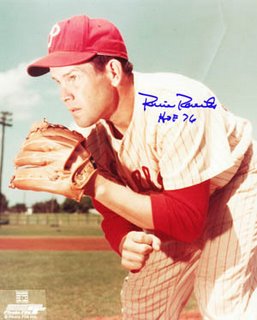 defense during the latter part of the decade significantly impacted Roberts performance. Had the Wiz Kids gone on and become a dynasty, Roberts might have gone on winning twenty games a season, that mystical number that separates “good” pitchers from “great” ones. He almost certainly would have won twenty games in 1956 and 1958, and he might have even posted a .500 record in 1957, when he lost those twenty-two games. My point in noting this is that one of the reasons why Roberts is under-valued in baseball history is that he dropped off after the ’55 season in the eyes of many observers. I don’t believe he suffered that much of a drop-off. From 1950 to 1960 he was basically the same pitcher, but the Phillies collapse late in the decade was poison to Roberts career. Thanks to this swoon Roberts fell short in getting to 300 career victories, that benchmark we all expect of great pitchers.
Toward the Hall of Fame: 1962 – 1966
In the fall of 1961 the Phillies sold Roberts to the Yankees for $25,000. The Phillies also retired Roberts #36 at the start of the season. Both he and the Phillies had moved on.
The Yanks promptly released Roberts prior to the 1962 season, whereupon he signed with the Baltimore Orioles. Roberts was rejuvenated with the Orioles. A young team trying to build for the future to compete with the Yankees, Roberts gave the Orioles just what they needed: an experienced veteran pitcher to teach them the ropes. The 1962 season was Roberts fifteenth in the major leagues. He was thirty-five. He pitched the next three and a half seasons, helping the young Orioles make the transition to become a contender. They actually briefly challenged the Yankees in 1964, the Yanks last great year, and came back to win the World Series over the L.A. Dodgers in a stunning upset in 1966. Roberts was long gone by then, however, having signed as a free agent during the 1965 campaign with the Houston Astros after having been released by the Orioles.
Roberts stay in Houston was brief. He finished the 1965 campaign and pitched for the beginning of the 1966 season with the Astros but was released once more. Roberts signed with the Chicago Cubs, finishing out the 1966 campaign, before being released once more. Here are Roberts stats from those seasons:
W-L ERA WHIP
1962: 10-9 2.78 1.13
1963: 14-13 3.33 1.07
1964: 13-7 2.91 1.25
1965: 10-9 2.98 1.05
1966: 5-8 4.28 1.44
HR/9 BB/9 K/9
1962: 0.80 1.93 4.80
1963: 1.25 1.43 4.44
1964: 0.79 2.29 4.81
1965: 0.85 1.42 4.58
1966: 1.21 1.69 4.34
1965: Baltimore & Houston
1966: Houston & Chicago
Here is how those seasons in Baltimore, Houston and Chicago stack up to his two Phillies eras:
W – L ERA WHIP
1950 – 1955: 138-78 2.93 1.09
1956 – 1961: 74-97 4.16 1.22
1962 – 1966: 52-46 3.19 1.16
And…
HR/9 BB/9 K/9
1950 – 1955: 0.82 1.65 4.47
1956 – 1961: 1.26 1.42 4.58
1962 – 1966: 0.98 1.74 4.61
Roberts actually tried to return to the Phillies for the 1967 season and spent time in the minor leagues pitching before electing to call it quits. He was forty years old and had hurled 4,688 & 2/3 innings in his career, facing 19,174 batters. He had won 286 games and lost 245.
Currently, Robin Roberts ranks twentieth in baseball history in innings pitched, twenty-sixth in wins, eighteenth in games started, thirty-eighth in complete games and eighteenth in batters faced. In Phillies history Roberts ranks second to Steve Carlton in wins and strikeouts and first in innings and games. What is remarkable to me is that Roberts is the Phillies all-time leader in complete games, having thrown more than any other pitcher, including the Phillies dead-ball era ace, Pete Alexander.
Roberts had an interesting assessment of his career: “I had a fine right arm and a great delivery, but I pitched too much and wore myself down. I wasn’t quite selfish enough or smart enough.” (The Quotable Baseball Fanatic, page 278.) Roberts felt that he tried to do too much and spread himself too thin to help the team. Here is what Robin Roberts did in his career in terms of Win Shares, a pretty good illustration of how tough and valuable he was:
Win Shares:
1948: 12
1949: 17
1950: 26
1951: 28
1952: 32
1953: 35
1954: 31
1955: 27
1956: 12
1957: 11
1958: 20
1959: 13
1960: 13
1961: 0
1962: 16
1963: 15
1964: 15
1965: 13
1966: 3
162 Game Average: 27.04
In the final analysis, Robin Roberts was an extra-ordinary pitcher, the likes of which we will probably never see again … okay, Roger Clemens, maybe … As I wrote this and as I began to read about the Wiz Kids I was struck by how little Roberts achievements mattered in the minds of the fandom and in the minds of baseball historians. So obsessed with New York, so blinded by the bright flame that was Sandy Koufax 1961 – 1966 run, historians remembering the 1950s and 1960s focused like a laser beam on the Yankees, the Dodgers, the Giants and on Koufax and utterly let Roberts memory drift away. Robin Roberts was the finest pitcher of the 1950s, and his successes in that decade were tremendous. He deserves to be remembered for being the most important player on the Wiz Kids in 1950, to be remembered for being one of the Phillies two greatest pitchers (Steve Carlton being the other), and for being the finest, most dominating pitcher of the 1950s.
The next time you go to Citizens Bank Ballpark think about what #36 did for the Phillies and remember. Now I know who that Robin Roberts guy was, and he was great.
Tomorrow I will shift my attention back to the World Series. Meanwhile, I have thoughts on the Eagles-Bucs game at The Bird Blog.
(11) comments
Since I began doing some reading into the Phillies history I’ve discovered what an exceptional player Roberts was, but I am utterly stunned that Robin Roberts isn’t
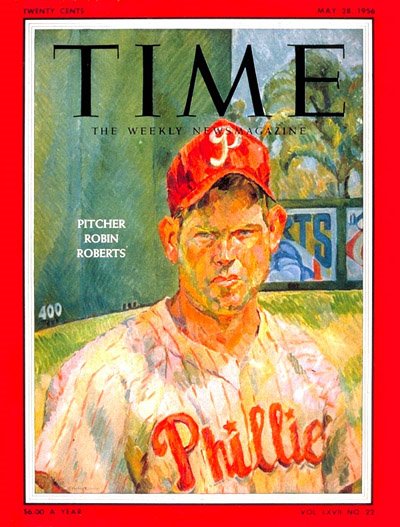 more remembered for his achievements by both Phillies fans and the baseball community at large. For being a Hall of Fame inductee – in fact, Roberts is the Phillies first Hall of Famer – he is curiously uncelebrated for his achievements with the Phillies and is largely unknown to most fans. One of the things that I am hopeful for with this series of posts is to shed more historical light on Robin Roberts. He deserves to be honored and remembered for being not only one of the greatest Phillies of all-time but perhaps the greatest pitcher the Phillies have ever had, even considering Steve Carlton. Robin Roberts was a giant in the history of the Phillies and it is time he gets his due.
Simply put, Robin Roberts was the best pitcher in baseball during the 1950s. From 1950-1956 he was an All-Star each year and placed in the top ten of the MVP voting five times, in 1950 and between 1952 and 1955. He led the N.L. in innings pitched from 1951 to 1955, led the NL in victories between 1952 and 1955, and had the best walk-to-strikeout ratio of an NL pitcher from 1952 to 1954, and again in 1956 and 1959. He also surrendered the fewest walks per nine innings pitched from 1952 to 1954 and in 1956. He started the All-Star Game for the NL five times (1950-1951, 1953-1955). He was the most dominant pitcher of his era.
Let me start off by saying that I am going to be using a lot of stats in this article. If you are confused about what I’m talking about, then here are the stats I refer to defined:
WHIP – Walks plus hits by innings pitched: (BB + H) / IP = WHIP
ERA – Earned Run Average: (Earned Runs * 9) / IP = ERA
FIP – Fielding Independent Pitching: (13*HR+3*BB-2*K / IP) + League Factor Evaluates a pitching by how he would have done with an average defense behind him by keeping track of things that a pitcher can control (walks, strikeouts, home runs allowed) as opposed to things he cannot (hits allowed, runs allowed).
DER – Defense Efficiency Ratio: (Batters Faced – (Hits + Walks + Hit By Pitch + Strikeouts)) / (Batters Faced – (Home Runs, Walks + Hit By Pitch + Strikeouts)) How often fielders convert balls put into play into outs.
HR/9 – Home Runs allowed per nine innings: (HR * 9) / IP
K/9 – Strikeouts per nine innings: (K * 9) / IP
BB/9 – Walks per nine innings: (BB * 9) / IP
Roberts career began in Michigan after his discharge from the Army Air Force in 1945. A talented athlete, he played basketball on a scholarship and a little baseball at Michigan State. After playing independent league ball in 1947, Roberts was signed to a deal with the Phillies and joined the minor league
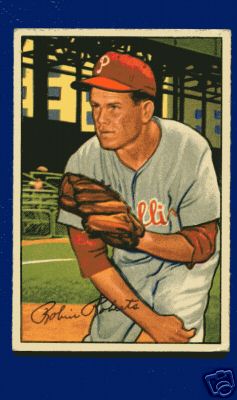 team in Wilmington, Delaware in 1948 where he made short work of the opposition. The Phillies sent him up to Philadelphia at the age of 22. Roberts remembered that he traveled from Hagerstown, Maryland, where his team was playing a game to Wilmington and then up to Philadelphia to Shibe Park where he was approached by then-manager Ben Chapman when he arrived at 6:00 P.M. After Chapman asked Roberts how he felt, he simply informed that he was making his major league debut in two hours against the Pittsburgh Pirates. Roberts lost, but allowed just five hits.
His first season with the Phillies was a triumph: he went 7-9 with a 3.19 ERA. It was a very successful debut. He was still developing his skills and his control wasn’t quite there, as he walked 3.74 batters per nine innings that season. In 1949 Roberts established himself as the team’s ace, going 15-15 with a 3.69 ERA. Here are some of his stats from that season, showing the strides that he was making as a pitcher:
HR/9: 0.60
BB/9: 2.98
K/9: 3.77
WHIP: 1.34
FIP ERA: 3.59
Generally, a trend emerges from the 1949 season that will stay with Roberts throughout his career. He doesn’t get many strikeouts, but he’s pretty good about surrendering home runs and he’s stingy with the walks allowed. Remembered one umpire who worked the National League in the ‘50s: “Roberts was a great pitcher. He was an umpire’s delight to work the plate with because he had uncanny control. The ball was always in or near the strike zone, and he had the players swinging at the ball all of the time. They weren’t waiting for bases on balls because Roberts didn’t give up bases on balls or very few of them.” (Page 360, Neyer/James Guide to Pitchers quoting Jocko.) Roberts is also durable in 1949, throwing 226 and two-thirds of an inning. Part of that was Roberts delivery towards home plate. According to Eddie Sawyer, Roberts manager: “[Roberts] had a very easy delivery. I call it symmetry of motion. It just flowed, pitch after pitch. He made it look easy.” (Page 360, Neyer/James Guide to Pitchers, quoting The Man in the Dugout.)
The Golden Era: 1950 – 1955
Roberts best seasons were between 1950 and 1955, six years where the Phillies, to varying degrees, were in contention for the National League pennant. In his Historical Baseball Abstract, Bill James ranked Robin Roberts has the sixteenth best pitcher of all-time, noting that between 1950 and 1955 Roberts led all pitchers in Win Shares, with the exception of 1951, where the Giants Sal Maglie narrowly bested him 27.75 to 27.71. In discussing Roberts remarkable achievements, James noted that Roberts probably never received the credit he was due in history because he never won the Cy Young Award, in part because the Cy Young Award was created in 1956, just when Roberts exceptional period of dominance came to an end. During that time Roberts was named The Sporting News pitcher of the year three times, so he likely would have won the Cy Young those seasons.
Roberts run, appropriately, kicks off with the Wiz Kids.
In 1950 Roberts has his first truly great statistical season, going 20-11 with a 3.02 ERA. Take a closer look at his numbers:
HR/9: 0.86
BB/9: 2.27
K/9: 4.32
WHIP: 1.17
FIP ERA: 3.55
At first glance, Roberts did surrender a lot of home runs – 29 – but that was largely a product of facing the second-highest number of batters in the NL that season: 1,228. Despite throwing as many innings as he did Roberts still did better than the NL averages for home runs allowed (0.89), walks (3.71) and strikeouts (4.09).
Roberts faced a lot of stress in 1950. After Curt Simmons, who went 17-8 with a 3.40 ERA that season, joined the National Guard following the outbreak of the Korean War, Roberts was carrying the Phillies for part of their run for the pennant and for nearly all of September. After Simmons and Jim Konstanty, the quality of the Phillies pitching staff fell off dramatically, leaving Roberts and Konstanty largely carrying the team to the pennant. In late July, for example, Roberts hurled three consecutive shutouts, keeping the opposition scoreless for thirty-two and two-thirds innings. Down the stretch, with the Phillies offense struggling to score runs, it was Roberts masterful pitching that kept the Phillies in the hunt for the playoffs.
On October 1, 1950, Roberts pitched one of the most important games in
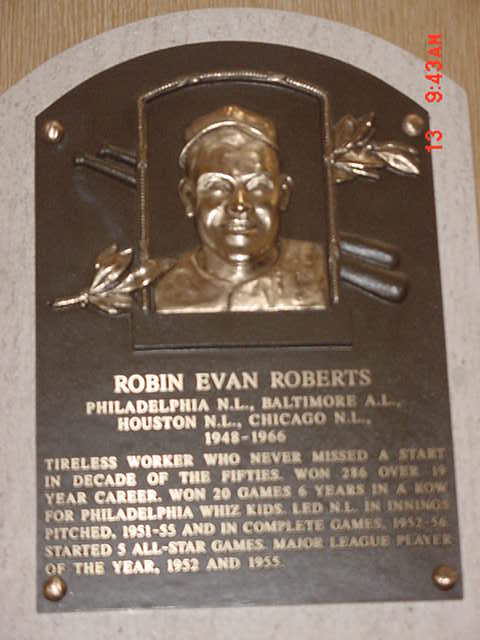 Phillies history. (See, Part XII of this series.) Leading the Brooklyn Dodgers by a game on the last day of the season the Phillies needed to win to avoid a playoff against the Dodgers for the pennant. The Phillies were reeling, having lost their last five games, including a 7-3 loss to the Dodgers the day prior. If they didn’t win, the Dodgers would have the edge in the playoff and the Phillies would have blown an insurmountable lead for the pennant.
Roberts blanked the Dodgers, the best offensive team in the National League, nearly all game long, surrendering a fluke home run to Pee Wee Reese in the sixth inning. In the bottom of the ninth the Dodgers nearly won the game when Duke Snider singled to centerfield and the Dodgers waved Cal Abrams home to score the winning run. Richie Ashburn snared Snider’s hit and hurled the ball to home plate to gun Abrams out. After Roberts survived the rest of the ninth, Dick Sisler hit a three run home run at the top of the tenth inning to give the Phillies a 4-1 lead. Roberts retired the side at the bottom of the tenth inning, despite having gotten lime into his eyes during the top of the tenth when he slid into third base. Ashburn was the hero, Sisler got the big hit, but it was Roberts clutch pitching which shut down the most dangerous team in the National League, holding them to a single run on five hits and three walks in ten innings of work. Roberts performance that day is even more impressive when you consider it was the third start he had worked in five days.
Without Roberts masterful pitching there would have been no tie game, there would have been no throw by Ashburn, there would have been no home run by Sisler and no pennant for the Wiz Kids.
Too tired to pitch Game One of the World Series, Roberts pitched in Game Two, four days after the climatic 4-1 win over the Dodgers. Roberts again hurled ten innings, surrendering ten hits and three walks. Roberts got just one run in support from the Phillies hitters, a sac fly from Ashburn to even the game at 1-1 in the fifth inning. Tied at 1-1, Roberts finally cracked in the top of the tenth inning, surrendering a lead-off home run to Joe DiMaggio, the only home run DiMaggio hit in the series. The Yankees won 2-1. Two days later the Yankees closed out the sweep of the Wiz Kids with a 5-2 victory at Yankee Stadium. Roberts hurled the eighth inning of the game, pressed into service to keep the Phillies faint hopes to win alive.
In 1951 the Wiz Kids stunned the baseball world and Philadelphia fans by going just 73-81, finishing twenty-three games out of first place. Memories of the Wiz Kids dramatic pennant were erased by the Giants climatic comeback and the Dynasty That Was To Be was nevermore. Nearly every player on the Phillies roster slumped that season. Despite the fact that the Phillies team DER dropped from second to fourth and their team ERA dropped from first to fourth, Roberts came back in 1951 with the same dominance. In a grim season, Roberts was a ray of hope for the future.
Roberts went 21-15 with a 3.03 ERA in 1951. A closer look at his stats gives you an idea about how dominant he was that season:
HR/9: 0.57
BB/9: 1.83
K/9: 3.63
WHIP: 1.10
FIP ERA: 3.07
The 1951 season represents a bit of a turning point for Roberts. His walks continued to drop, the home runs dropped as well and he became even tougher to get a hit off of. It was Roberts first season to lead the National League in innings pitched as well. Once more he was second in batters faced. All of this playing for a team that had difficulty supplying him with runs even when they were playing well. The ’51 Phillies were sixth in the NL in runs scored, down from fourth in ’50. The ’51 Phils scored seventy-four fewer runs than the ’50 team did, so wins were far harder to come by.
The transition to ace pitcher was complete:
1949 1950 1951
HR/9: 0.60 0.86 0.57
BB/9: 2.98 2.27 1.83
K/9: 3.77 4.32 3.63
WHIP: 1.34 1.17 1.10
FIP ERA: 3.59 3.55 3.07
But the ’51 campaign was a massive failure for the Phillies. They fought to finish fifth and left fans anticipating another pennant bitterly disappointed. Eddie Sawyer’s days as manager were numbered. He was gone in ’52, as the Phillies climbed back to respectability. To help Roberts, Curt Simmons returned from the Army and was spectacular in 1952, going 14-8 with a 2.82 ERA*, but the Phillies offense was still much worse than the rest of the NL, and the Phillies defense was just fifth in the NL in DER.
The 1952 Phillies got off to a lousy start, fired Eddie Sawyer and promptly rolled off 59 wins in their last 91 games (.648), going from sixth place and seventeen and a half games out of first place to fourth place, just nine and a half games out. The ’52 Phils hot finish convinced many that the Return of the Wiz Kids were right around the corner.
* Earlier I noted that Roberts started the All-Star Game for the NL every season between 1950 and 1955 save one, 1952. Simmons started the ’52 All-Star Game for the NL. A Phillies pitcher started the All-Star Game every year from 1950 to 1955 (and then Curt Simmons started the '57 game). That was how dominant the Phillies pitching was in the ‘50s.
The ’52 season was also Roberts greatest. He went 28-7 with a 2.59 ERA that season and thoroughly dominated the National League. A major factor in Roberts success was his decision to adopt the Giants Sal Maglie’s “hard curve” that season to replace his own slow curve which he felt didn’t work. (Neyer / James Guide to Pitchers, page 360, quoting My Life in Baseball.) Here is a closer look at those numbers:
HR/9: 0.60
BB/9: 1.22
K/9: 4.03
WHIP: 1.02
FIP ERA: 2.86
Roberts dominance that season was scary. Roberts obliterated the NL averages that season for home runs (0.74), walks (3.39) and WHIP (1.34). Roberts finished under the league average for strikeouts (4.28), but his control of the strike-zone and ability to get the opposition to put weak hits into play were the reasons why he was so special.
That season he led the National League in wins with twenty-eight, a whopping ten more than the Giants Maglie; had the best strikeout-to-walk ratio in the N.L., 3.29, much better than the Cubs Warren Hacker at 2.71; allowed the fewest walks per nine innings, 0.29 better than Hacker; faced the most batters, 1,310, 120 more than the Braves Warren Spahn; threw the most innings, 330, forty more than Spahn, started the most games, 37, two more than Spahn; and threw the most complete games, 30, nine more than the Pirates Murry Dickson. He finished second in WHIP to Hacker (0.946), and third in ERA, behind Hacker (2.58) and the Giants Hoyt Wilhelm (2.43). Stunningly, Roberts completed his final twenty-eight starts in 1952. Think about that in our age of five, six, seven inning starts: Robin Roberts went the distance twenty-eight consecutive times in 1952.
Roberts and Simmons were the one-two punch that the Phillies had dearly lacked in 1951 and were a major reason why the team once more had the best ERA in the N.L. Roberts ability to control the strike-zone is a major reason why the Phillies averaged nearly a walk fewer per nine innings than any other National League team (2.4, better than the Cardinals 3.3). Roberts was so good in 1952 that he actually finished second in the MVP voting to the Cubs Hank Sauer, getting 211 votes to Sauer’s 226. I would never expect to see a pitcher factor much in the MVP voting today, and I can’t fathom that one would nearly beat a position player for the award in the 1950s, an era that valued hitting over pitching. (Though teammate Jim Konstanty did just that in 1950.)
The next season Roberts ran his consecutive complete games streak to thirty-three on his way to a 23-16 record with a 2.75 ERA. The ’53 Phillies played well, but couldn’t survive an injury to Curt Simmons and watched as the Brooklyn Dodgers won the pennant in a walk. The ’53 team won 83 games but the Dodger went 105-49 and buried the Phillies twenty-two games out of first. Still, it was another great season for Roberts:
HR/9: 0.78
BB/9: 1.58
K/9: 5.14
WHIP: 1.11
FIP ERA: 3.20
He finished tied for first in wins with Warren Spahn, first in strikeouts (the first time he led the National League in this category), first in walks per nine innings, first in games started with 41, first in complete games with 33 (nine more than Spahn), first in innings pitched with 346 & 2/3 (eighty-one more than Spahn), first in batters faced with 1,422 (a whopping 357 more than Spahn) and first in strikeout-to-walk ratio at 3.25, 0.89 better than the Cardinals Harvey Haddix. Roberts had the second-best WHIP (best: Spahn at 1.058) and the second-best ERA (best: Spahn at 2.10). Warren Spahn might have posted impressive stats, but he did so on a team that provided him with plenty of run support and he threw many fewer innings – eighty-one fewer to be exact – than Roberts.
Once more Roberts was in the thick of the MVP voting, finishing sixth. The run-away winner of the MVP award that season was the Dodgers Campanella, who got 297 of the maximum 336 votes.
The 1954 was the continuation of a familiar pattern for Roberts as a Phillie. The team had promise but would falter badly, while he would be left to try to keep the Phillies in the mix. The Phillies pitching staff was the third-best in the majors that season, allowing just a 3.59 ERA, almost exclusively a product of Roberts sterling pitching. The problem was that their offense couldn’t generate enough runs to convert Roberts good starts into victories. In 1953 Roberts was the losing pitcher in 16 games. He’d lose another 15 in 1954. Roberts did win 23 games in 1954, the fifth consecutive season he won twenty or more games.
Roberts was again spectacular for the Phillies:
HR/9: 0.94
BB/9: 1.50
K/9: 4.95
WHIP: 1.02
FIP ERA: 3.23
He led the National League in wins, strikeouts, complete games, games started, WHIP, walks allowed per nine innings, strikeout-to-walk ratio, innings pitched and batters faced. He finished sixth in ERA. During the ’54 campaign Roberts tossed a pair of one-hitters and went fifteen innings to win a game 3-2 against the St. Louis Cardinals on June 17th, 1954. Roberts finished seventh in the MVP voting that season.
The 1955 season was marked a bit of a turning point for Roberts. Between 1951 and 1954 his FIP ERA had been 3.07, 2.86, 3.20 and 3.23. Now it would climb somewhat, to 3.59, the highest it had been since 1949. He still pitched well in 1955, but it was the end of his dominating period over the National League. It was also the last time that he would start the All-Star Game for the National League, and the last time he would win twenty or more games, which he had done six consecutive seasons. Roberts went 23-14 with a 3.28 ERA that season.
HR/9: 1.21
BB/9: 1.56
K/9: 4.72
WHIP: 1.13
FIP ERA: 3.59
Roberts still led the National League in wins, innings, batters faced, complete games and games started, but he finished second in walks allowed per nine innings, WHIP, strikeouts, and strikeout-to-walk ratio to the Dodgers Don Newcombe. Roberts also finished fifth in ERA. Once more the Phillies disappointed, losing 21 of their first 31 games. On May 18th, they were already fourteen games behind the Brooklyn Dodgers. Their season was finished, despite winning forty of their last sixty-nine games. They finished twenty-one and a half games out of the pennant race. 1955 also represented the end of the Phillies period of success during the 1950s. Despite disappointing fans by not returning to the World Series during the early 1950s, the Phillies had generally been in the mix and had finished fourth each season thanks to their strong pitching staff, which had been one of the best consistently each season.
So how does Roberts run of dominance look to us, some fifty years later? Utterly astonishing. Just compare Roberts walk rate to that of his contemporaries:
BB/9: Roberts / League / Diff.
1950: 2.27 / 3.75 / 1.48
1951: 1.83 / 3.57 / 1.74
1952: 1.22 / 3.45 / 2.23
1953: 1.58 / 3.52 / 1.94
1954: 1.50 / 3.67 / 2.17
1955: 1.56 / 3.53 / 1.97
Aside from 1950 and 1951, every season Roberts was twice as good as what the rest of the league was doing. Take the ’52 season: Roberts allowed just 45 walks in 330 innings of work, or 1.22 per nine innings. The rest of the National League allowed 3.45, nearly three times as many as Roberts. Roberts was simply in his own world. Nobody could touch him. Nobody, in this era, the 1950s, where the walk to strikeout ratio was somewhere near 1-to-1 … well, specifically between 1950 and 1955 there were 25,920 walks and 30,805 strikeouts in the National League, meaning there were 1.19 strikeouts to walks … could do what Robin Roberts was doing. He was so stingy with the walks that his good-to-average strikeout numbers still gave him a 2.71 to 1 strikeout-to-walk ratio. That’s better than twice as good as what the rest of the league was doing. Oh, and Roberts hurled so many innings during this time that when you delete his numbers from the rest of the National League, the N.L.’s overall K/BB ratio falls to 1.17. A single player made a significant change to the league’s stats.
In his Historical Abstract, Bill James named Robin Roberts the best pitcher in baseball during the 1950s four times: 1950, 1953, 1954 and 1955 (interestingly, not awarding Roberts with the top spot for his best statistical season, 1952). Here is an overview of those stats for the 1950s:
W-L ERA WHIP
1950: 20-11 3.02 1.18
1951: 21-15 3.03 1.10
1952: 28-7 2.59 1.02
1953: 23-16 2.75 1.11
1954: 23-15 2.97 1.02
1955: 23-14 3.28 1.13
HR/9 BB/9 K/9
1950: 0.86 2.27 4.32
1951: 0.57 1.83 3.63
1952: 0.60 1.22 4.03
1953: 0.78 1.58 5.14
1954: 0.94 1.50 4.95
1955: 1.21 1.56 4.72
I really only think that there is one other pitcher who had the kind of impact on his era like Robin Roberts: Sandy Koufax. The comparison isn’t perfect – Koufax was a strikeout artist, Roberts wasn’t – but they were both dominant in their leagues during their times. What interests me about the comparison between Roberts and Koufax is that Roberts accomplished his remarkable feats during the era of offense, when teams scored runs in bushels. Koufax was the most dominant pitcher in an era where pitchers held all of the cards. For example, Koufax allowed just 1.68 walks per nine innings in 1963. The league average that season was lower than it had been in the 1950s: 2.82. While Koufax was doing remarkable things during the 1960s, Roberts was a statistical anomaly, a pitcher who was dominant in an era where the batters held the cards. In 1963 there were 2.09 strikeouts to walks. In 1964 the K/BB ratio was 2.10 to 1. In 1965 it was 2.03 to 1. Koufax was a remarkable pitcher, but he must be considered in his context. He was getting a lot of strikeouts and keeping guys from getting walks, but he did so in an era where pitchers were starting to dominate. Roberts has to be evaluated in his context as well: his stats contrast well with Koufax and he did that in a offense-friendly era.
In addition to comparing their performances on the mound in their respective periods, I also think it is interesting to compare Sandy Koufax’s temperament to Roberts. Both had reputations for being calm, polite players who won the respect of their peers because they didn’t engage in absurd posturing or loud, obnoxious behavior. T.O. could have learned from both of these guys. Roberts himself said: “I was mainly a one-pitch pitcher, although sometimes I mixed in a curveball when I was ahead in the count. I could put my fastball where I wanted it, but I was sometimes criticized for not pitching inside more and not knocking hitters down … Well, lots of people talked about knocking batters down but few did it. And it just wasn’t me. I just went after people with my best stuff and let the batters hit it if they could. That was my act, and it got me through eighteen years in the big leagues.” Neyer / James Guides to Pitchers, page 360, quoting My Life in Baseball by Robin Roberts.) Said Eddie Sawyer: “[Roberts] would never throw at hitters. They knew this and would go up there and take a toehold, but he would still get them out. He did it with speed, control and stamina.” (Neyer / James Guides to Pitchers, page 360, quoting The Man in the Dugout.) Koufax and Roberts both conducted themselves with grace and dignity, traits that modern players seem to hold in short supply.
Koufax, who retired from baseball following the 1966 World Series at roughly the same time as Roberts (1967), got into the Hall of Fame quickly, whereas Roberts was forced to wait a few years before being elected. Underrated, undervalued by history, Roberts remarkable run has gone largely unremembered. This was a pitcher every bit as good as Sandy Koufax, but who had the misfortune to toil on a team that was not in New York or Los Angeles, and who never won the World Series as Koufax did in 1963 and 1965. Ken Burns Baseball series spent considerable time on Koufax and the ’60s Dodgers (actually they spent loads of time on the Dodgers regardless of the era), but to my recollection Robin Roberts and the Wiz Kids rated nary a mention.
Bill James argued in his Historical Baseball Abstract that Koufax deserves special recognition beyond simply being a great pitcher for being THE integral part of the Dodgers ’63, ’65 and ’66 pennant-winners, a factor to James that makes Koufax great beyond his raw numbers. I submit that Roberts tough performance in 1950 – pitching the decisive game of the season on three days rest after having started two games within the last five days, then allowing just one run in ten innings while pitching the climatic tenth with irritated, blurred vision – makes him THE integral part of the Wiz Kids run to the pennant. I think that Roberts deserves recognition for that and credit for being great beyond his statistics.
One little aside before I move onto Roberts final seasons with the Phillies – Roberts was, for a pitcher, a okay hitter. In 1955 he had a .360 OBP (he was 27-for-107 with eighteen walks), with two home runs, four triples, nine doubles, 13 RBIs, and 12 runs scored. His GPA that season was .279 and he had 18 Runs Created. His performance was a bit of an anomaly, but something to consider in evaluating his remarkable career.
Toiling in Obscurity: 1956 – 1961
Roberts run came to an end in 1955, but he still continued to be a dominant pitcher for some time. In 1956 the Phillies pitching was the worst in the National League. The decline in the quality of the Phillies pitching can be directly traced to Roberts struggles that season. Hampered by a leg injury, for the first time since 1949 he failed to win twenty games, going 19-18, losing his chance for a twentieth win on the final day of the season. Roberts also allowed 46 home runs that season, a major league record. His ERA jumped from 2.97 in ’54 to 3.28 in ’55 to 4.45 in ’56.
HR/9: 1.39
BB/9: 1.21
K/9: 4.75
WHIP: 1.24
FIP ERA: 3.65
While the decline in Roberts output seemed dramatic, it really wasn’t. His FIP barely inched up compared to what he did in ’55, and he actually did slightly better with walks and strikeouts that season. Roberts had been losing a lot of games for a while, a product of the fact that he was pitching so many of the Phillies innings and absorbing a lot of the losses in games where they couldn’t do any better than muster a run or two. Roberts simply gave up a few more home runs than he usually did in 1956, but the effect on his career was considerable.
Roberts finished just twenty-third in the MVP voting in 1956, with seven votes out of 336. He once more led the National League in walks allowed per nine innings, in strikeout-to-walk ratio, and in complete games. But 1956 marked the start of a new, more difficult time for Roberts.
In 1957 the Phillies were 77-77 and finished eighteen games out of first place. Roberts also had a difficult season, going 10-22 with a 4.07 ERA.
HR/9: 1.44
BB/9: 1.55
K/9: 4.61
WHIP: 1.56
FIP ERA: 4.15
The 1957 season seems a clear case where the Phillies anemic offense cost Roberts a number of games. Roberts pitched so many games with so many innings that he racked up many decisions and often lost games that might have gone to other pitchers. The twenty-two losses looked much worse than they were, but clearly he was back-sliding somewhat.
The following season, 1958, Roberts rebounded. That season he went 17-14 with a much-improved 3.24 ERA, his best since 1954. Statistically, Roberts turned in a terrific season:
HR/9: 1.00
BB/9: 1.70
K/9: 4.34
WHIP: 1.19
FIP ERA: 3.62
The problem for the Phillies was that they had cratered badly, dropping from 77-77 and fifth place to 69-85 eighth place, dead last in the N.L. It was the Phillies first dead-last finish since 1947. Despite the Phillies blunders Richie Ashburn had won the batting title and had his most productive season offensively. Roberts ranked on the leader boards as well, finishing third in WHIP, fourth in innings pitched and batters faced, second in complete games, and second in strikeouts-to-walk ratio and in walks allowed per nine innings. Surely the last Wiz Kids knew that the end was near.
1959 brought a second consecutive last-place finish for the Phillies. Many of the former Wiz Kids left at this juncture. Richie Ashburn slumped badly in ’59 and went to the Cubs after the season ended. Willie Jones and Granny Hammer retired. Roberts continued on, still amassing impressive stats. He went 15-17 that season with a 4.27 ERA, over a run higher than it had been in 1958, although I’d note that Roberts FIP ERA was relatively unchanged, which suggests that the problems might have been more with the (poor) quality of the Phillies defense than with Roberts. Notice that Ashburn had his worst season as a Phillie that year, a factor that strongly impacted the defense that surrounded Roberts on the field.
Roberts did his best, however. For the fifth and final time he led the N.L. in strikeout-to-walk ratio, and finished third in walks allowed per nine innings. He was thirty-two and it was his twelfth major league season:
‘59
HR/9: 1.18
BB/9: 1.22
K/9: 4.79
WHIP: 1.17
FIP ERA: 3.75
The 1950’s were over. It was a bitterly disappointing era for the Phillies: they had begun it by winning the N.L. pennant with a young team and never returned. Despite this, Roberts had a great decade.
On Opening Day, 1960, Robin Roberts and Curt Simmons were the sole Phillies left on the roster that played for the Wiz Kids. Simmons was released on May 17th and made his way to the St. Louis Cardinals, where he’d help win the 1964 World Series, and Roberts became the lone leftover from the ’50 team. He, once more, turned in a strong performance as, once more, the Phillies limped to an eighth place finish, trailing the Pirates that season by thirty-six games. Roberts went 12-16 with a 4.02 ERA. The decline in the quality of the fielders behind Roberts appears to be a major factor here as Roberts actual ERA climbed higher than his FIP:
‘60
HR/9: 1.17
BB/9: 1.29
K/9: 4.63
WHIP: 1.22
FIP ERA: 3.81
The 1961 season was an utter disaster for the Phillies. Between July 28 and August 20, 1961, the Phillies dropped twenty-three consecutive games. The team lost 107 games that season, a tough feat to accomplish in an era when they played just 154 games. Roberts clashed with abrasive manager Gene Mauch – who stated that season that Roberts threw “like Betsy Ross” and would led the Phillies into their epic collapse in 1964 – and struggled badly, having his worst statistical season ever, going 1-10 with a 5.85 ERA:
‘61
HR/9: 1.46
BB/9: 1.76
K/9: 4.15
WHIP: 1.51
FIP ERA: 4.51
It was the end of the road for Roberts with the Phillies. Since 1955 he had pitched well, but he couldn’t match that level of dominance he achieved from 1950 – 1955:
W-L ERA WHIP
1956: 19-18 4.45 1.24
1957: 10-22 4.07 1.16
1958: 17-14 3.24 1.19
1959: 15-17 4.27 1.17
1960: 12-16 4.02 1.22
1961: 1-10 5.86 1.51
HR/9 BB/9 K/9
1956: 1.39 1.21 4.75
1957: 1.44 1.55 4.61
1958: 1.00 1.70 4.34
1959: 1.18 1.22 4.79
1960: 1.17 1.29 4.63
1961: 1.46 1.76 4.15
To compare how dominant Roberts was during the earlier half of the 1950s, check out the differences between the two halves of the decade:
W – L ERA WHIP
1950 – 1955: 138-78 2.93 1.09
1956 – 1961: 74-97 4.16 1.22
The interesting thing is that, aside from Home Runs, Roberts actually posted somewhat better stats in the latter part of the decade:
HR/9 BB/9 K/9
1950 – 1955: 0.82 1.65 4.47
1956 – 1961: 1.26 1.42 4.58
This is utter speculation on my part, but I wonder if the Phillies decline in
 defense during the latter part of the decade significantly impacted Roberts performance. Had the Wiz Kids gone on and become a dynasty, Roberts might have gone on winning twenty games a season, that mystical number that separates “good” pitchers from “great” ones. He almost certainly would have won twenty games in 1956 and 1958, and he might have even posted a .500 record in 1957, when he lost those twenty-two games. My point in noting this is that one of the reasons why Roberts is under-valued in baseball history is that he dropped off after the ’55 season in the eyes of many observers. I don’t believe he suffered that much of a drop-off. From 1950 to 1960 he was basically the same pitcher, but the Phillies collapse late in the decade was poison to Roberts career. Thanks to this swoon Roberts fell short in getting to 300 career victories, that benchmark we all expect of great pitchers.
Toward the Hall of Fame: 1962 – 1966
In the fall of 1961 the Phillies sold Roberts to the Yankees for $25,000. The Phillies also retired Roberts #36 at the start of the season. Both he and the Phillies had moved on.
The Yanks promptly released Roberts prior to the 1962 season, whereupon he signed with the Baltimore Orioles. Roberts was rejuvenated with the Orioles. A young team trying to build for the future to compete with the Yankees, Roberts gave the Orioles just what they needed: an experienced veteran pitcher to teach them the ropes. The 1962 season was Roberts fifteenth in the major leagues. He was thirty-five. He pitched the next three and a half seasons, helping the young Orioles make the transition to become a contender. They actually briefly challenged the Yankees in 1964, the Yanks last great year, and came back to win the World Series over the L.A. Dodgers in a stunning upset in 1966. Roberts was long gone by then, however, having signed as a free agent during the 1965 campaign with the Houston Astros after having been released by the Orioles.
Roberts stay in Houston was brief. He finished the 1965 campaign and pitched for the beginning of the 1966 season with the Astros but was released once more. Roberts signed with the Chicago Cubs, finishing out the 1966 campaign, before being released once more. Here are Roberts stats from those seasons:
W-L ERA WHIP
1962: 10-9 2.78 1.13
1963: 14-13 3.33 1.07
1964: 13-7 2.91 1.25
1965: 10-9 2.98 1.05
1966: 5-8 4.28 1.44
HR/9 BB/9 K/9
1962: 0.80 1.93 4.80
1963: 1.25 1.43 4.44
1964: 0.79 2.29 4.81
1965: 0.85 1.42 4.58
1966: 1.21 1.69 4.34
1965: Baltimore & Houston
1966: Houston & Chicago
Here is how those seasons in Baltimore, Houston and Chicago stack up to his two Phillies eras:
W – L ERA WHIP
1950 – 1955: 138-78 2.93 1.09
1956 – 1961: 74-97 4.16 1.22
1962 – 1966: 52-46 3.19 1.16
And…
HR/9 BB/9 K/9
1950 – 1955: 0.82 1.65 4.47
1956 – 1961: 1.26 1.42 4.58
1962 – 1966: 0.98 1.74 4.61
Roberts actually tried to return to the Phillies for the 1967 season and spent time in the minor leagues pitching before electing to call it quits. He was forty years old and had hurled 4,688 & 2/3 innings in his career, facing 19,174 batters. He had won 286 games and lost 245.
Currently, Robin Roberts ranks twentieth in baseball history in innings pitched, twenty-sixth in wins, eighteenth in games started, thirty-eighth in complete games and eighteenth in batters faced. In Phillies history Roberts ranks second to Steve Carlton in wins and strikeouts and first in innings and games. What is remarkable to me is that Roberts is the Phillies all-time leader in complete games, having thrown more than any other pitcher, including the Phillies dead-ball era ace, Pete Alexander.
Roberts had an interesting assessment of his career: “I had a fine right arm and a great delivery, but I pitched too much and wore myself down. I wasn’t quite selfish enough or smart enough.” (The Quotable Baseball Fanatic, page 278.) Roberts felt that he tried to do too much and spread himself too thin to help the team. Here is what Robin Roberts did in his career in terms of Win Shares, a pretty good illustration of how tough and valuable he was:
Win Shares:
1948: 12
1949: 17
1950: 26
1951: 28
1952: 32
1953: 35
1954: 31
1955: 27
1956: 12
1957: 11
1958: 20
1959: 13
1960: 13
1961: 0
1962: 16
1963: 15
1964: 15
1965: 13
1966: 3
162 Game Average: 27.04
In the final analysis, Robin Roberts was an extra-ordinary pitcher, the likes of which we will probably never see again … okay, Roger Clemens, maybe … As I wrote this and as I began to read about the Wiz Kids I was struck by how little Roberts achievements mattered in the minds of the fandom and in the minds of baseball historians. So obsessed with New York, so blinded by the bright flame that was Sandy Koufax 1961 – 1966 run, historians remembering the 1950s and 1960s focused like a laser beam on the Yankees, the Dodgers, the Giants and on Koufax and utterly let Roberts memory drift away. Robin Roberts was the finest pitcher of the 1950s, and his successes in that decade were tremendous. He deserves to be remembered for being the most important player on the Wiz Kids in 1950, to be remembered for being one of the Phillies two greatest pitchers (Steve Carlton being the other), and for being the finest, most dominating pitcher of the 1950s.
The next time you go to Citizens Bank Ballpark think about what #36 did for the Phillies and remember. Now I know who that Robin Roberts guy was, and he was great.
Tomorrow I will shift my attention back to the World Series. Meanwhile, I have thoughts on the Eagles-Bucs game at The Bird Blog.
![]()


