Friday, January 12, 2007
Listen to me!
Check out my latest appearance on Philly Sports Talk with Rich and Jim Dogg. I had a blast and the show was a ton of fun. Check it out!
(1) comments
Book Review: Little League, Big Dreams
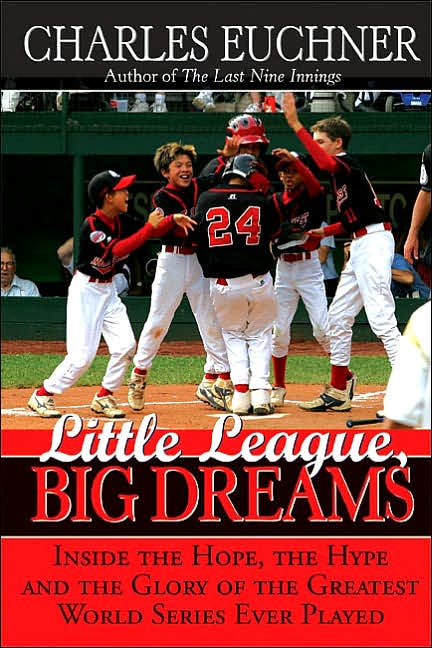 I am embarrassed that it took me as long as it did for me to get around to reviewing as excellent a book as this. Written by Charles Euchner, author of The Last Nine Innings, an excellent dissection of Game Seven of the 2001 World Series, Little League, Big Dreams is a well-written dissection of the Little League World Series.
Before I picked up the book I had no idea about the spectacle the game up in beautiful Williamsport, PA, had become. The thousands of fans, the television cameras, the money and the passionate competition … the parents pushing their children to excel when they haven’t even hit high school. Euchner does a nice job picking up a lot of threads – the teams from Hawaii, the team from Japan – and giving the reader a full tapestry about the kids that compete there from so many different and varied backgrounds. Very well done.
-Hopefully a deal for Jon Lieber is going to happen sooner rather than later.
-Eagles game is tomorrow night at eight. GO BIRDS!!!!
Thursday, January 11, 2007
New Defensive Metrics, Part III...
As I mentioned on Monday, there are a lot of defe nsive metrics out there that are emerging and are adding to our assessment of how the Phillies struggled defensively in 2006. Today I will be looking at Dave Pinto’s Probabilistic Model of Range (PMR), a tool that I oftentimes consult and you can find at Dave's website, Baseball Musings. In a nutshell, PMR takes a look at the outs that a fielder records over the course of a season and compares that to what he should have done based on a number of factors. If the fielder exceeds the projected totals, he’s got plus numbers, if not he’s not negative numbers.
Let’s start with teams results. Right away, PMR confirms what John Dewan’s Plus / Minus and most observers already knew. The ’06 Phillies struggled:
PMR:
1. New York Mets: +.01188
2. St. Louis Cardinals: +.01153
3. San Diego Padres: +.00978
4. San Francisco Giants: +.00968
5. Houston Astros: +.00837
6. Chicago Cubs: +.00687
7. Milwaukee Brewers: +.00617
8. Arizona Diamondbacks: +.00519
9. Atlanta Braves: +.00375
10. Colorado Rockies: +.00197
11. Philadelphia Phillies: -.00133
12. Los Angeles Dodgers: -.00348
13. Florida Marlins: -.00414
14. Cincinnati Reds: -.00591
15. Pittsburgh Pirates: -.00900
16. Washington Nationals: -.01035
There are no real surprises in that group. The Reds, the Pirates and the nats are all teams you’d expect to be average-to-mediocre in terms of defense.
Let’s start with Aaron Rowand, the Phillies center fielder and the subject of much hope at the outset of the season. PMR rates Rowand quite good in 2005: +.01954 That put him near the top of CF’s, better than Calros Beltran, Torii Hunter and Mark Kotsay. He even rated better than Jim Edmonds (+.01722). Rowand actually continues to rate well in 2006, posting a +.00451, which again rates him better than Edmonds, Hunter and Kotsay (although Carlos Beltran had a great season at +.00519). This is a bit of a surprise given that Rowand rates a -4 according to John Dewan’s Plus / Minus system.
Shane Victorino actually ranks third overall at +.00581, which is extremely good and confirms my suspicion that he is an outstanding defensive center fielder. It does perplex me: if Rowand was a -4 and Victorino rated well, then how did the Phillies outfield play so badly?
In what might be a surprise to … well, nobody, the Phillies had terrible left field play in 2006 according to PMR. Check it out:
Pat Burrell: -.00314
The good news for Burrell was that … well, Manny Ramirez was worse (-.00856). It was about in line with Burrell’s horrible, awful 2005 campaign (-.00302). How bad was that? Manny Ramirez rated better (-.00301). There were only three players in the PMR model that did worse than Burrell, and one of those was future Phillie Dellucci. Ouch. I’ll be eager to see what Plus / Minus has to say given that we are unsure at the moment of the data. I’ll bet that Burrell rates a -10 or -15.
Over in right field, the story didn’t get much better. Bobby Abreu the Phillies Gold Glove-winning right fielder in 2005 posted a +.00010 for 2006, down from his .00148 in ’05. Abreu’s Gold Glove was a very embarrassing moment for baseball, giving an award for a performance that defied what the data told us and what the fans who simply watched the game knew in their hearts. Mercifully that was not repeated in 2006, but now that Abreu plays in New York, expect the media to fawn over his defensive prowess.
On to the infield:
First up, David Bell, the Phillies former third baseman and much maligned and praised figure on this blog. As I always note, David Bell was a weak offensive performer and a strong defensive presence in the Phillies lineup. PMR gives him some nice marks:
PMR: +.00347
Solid, much a major decline from his 2005 numbers: +.01260 …I think you can see that decline playing out in his Plus / Minus numbers as well. Remember, Bell went from +24 in 2005 to just +8 in 2006. Bell’s replacement, Abraham Nunez, has an interesting story to tell through as PMR. As I noted in my Monday column, we don’t know how many of the Phillies performed because some of the individual Plus / Minus data isn’t available yet. We can safely say that Abraham Nunez will rate badly on Plus / Minus, if his PMR is any judge. Consider the differences from 2005 to 2006:
2005: +.01234
2006: -.00128
Nunez went from being in the top third of defensive third basemen to being in the bottom third. I can virtually guarantee that Nunez will rate badly when the PMR numbers emerge.
Moving over to second base … Chase Utley ranks third in Plus / Minus with a sterling +19 at second base. PMR is a little less enthusiastic about Chase, although he rates well, a little out of the top third: +.00383 … Chase rated much, much better in 2005: +.01478, a season where he posted a +26 in Plus / Minus …
At first base we have 2006 N.L. MVP Ryan Howard. Ryan will be happy that almost nobody cares about how well a first baseman fields, because he might have lost the MVP if voters factored defense: Ryan’s -.00631 PMR was the fifth-worst in the majors. Pujols? He was the second-best, with a +.00998. Again PMR and Plus / Minus are in agreement about something: in 2005 PMR rated Ryan Howard as being a terrific defensive first baseman, with a +.00612, which was actually better than Albert Pujols +.00557 … Ryan’s ’05 and ’06 Plus / Minus numbers are a wild swing from +16 in 2005 to -8 this season. That drop-off was major and likely a big factor in why the Phillies struggled defensively.
At shortstop is the only place where I see PMR and Plus / Minus departing company. The Phillies have an excellent shortstop, Jimmy Rollins. Plus / Minus gives J.Roll a positive rating at +12, which was seventh in the majors. PMR ranks J.Roll in the bottom third of shortstops at -.00025. Draw your own conclusions.
I like PMR and I like to use it in my blog, but I like stats like Plus / Minus a little more because they are easier to comprehend. However, I do find Dave’s PMR does accurately track how players perform and I find it to be an invaluable tool in evaluating the Phillies.
(0) comments
 nsive metrics out there that are emerging and are adding to our assessment of how the Phillies struggled defensively in 2006. Today I will be looking at Dave Pinto’s Probabilistic Model of Range (PMR), a tool that I oftentimes consult and you can find at Dave's website, Baseball Musings. In a nutshell, PMR takes a look at the outs that a fielder records over the course of a season and compares that to what he should have done based on a number of factors. If the fielder exceeds the projected totals, he’s got plus numbers, if not he’s not negative numbers.
Let’s start with teams results. Right away, PMR confirms what John Dewan’s Plus / Minus and most observers already knew. The ’06 Phillies struggled:
PMR:
1. New York Mets: +.01188
2. St. Louis Cardinals: +.01153
3. San Diego Padres: +.00978
4. San Francisco Giants: +.00968
5. Houston Astros: +.00837
6. Chicago Cubs: +.00687
7. Milwaukee Brewers: +.00617
8. Arizona Diamondbacks: +.00519
9. Atlanta Braves: +.00375
10. Colorado Rockies: +.00197
11. Philadelphia Phillies: -.00133
12. Los Angeles Dodgers: -.00348
13. Florida Marlins: -.00414
14. Cincinnati Reds: -.00591
15. Pittsburgh Pirates: -.00900
16. Washington Nationals: -.01035
There are no real surprises in that group. The Reds, the Pirates and the nats are all teams you’d expect to be average-to-mediocre in terms of defense.
Let’s start with Aaron Rowand, the Phillies center fielder and the subject of much hope at the outset of the season. PMR rates Rowand quite good in 2005: +.01954 That put him near the top of CF’s, better than Calros Beltran, Torii Hunter and Mark Kotsay. He even rated better than Jim Edmonds (+.01722). Rowand actually continues to rate well in 2006, posting a +.00451, which again rates him better than Edmonds, Hunter and Kotsay (although Carlos Beltran had a great season at +.00519). This is a bit of a surprise given that Rowand rates a -4 according to John Dewan’s Plus / Minus system.
Shane Victorino actually ranks third overall at +.00581, which is extremely good and confirms my suspicion that he is an outstanding defensive center fielder. It does perplex me: if Rowand was a -4 and Victorino rated well, then how did the Phillies outfield play so badly?
In what might be a surprise to … well, nobody, the Phillies had terrible left field play in 2006 according to PMR. Check it out:
Pat Burrell: -.00314
The good news for Burrell was that … well, Manny Ramirez was worse (-.00856). It was about in line with Burrell’s horrible, awful 2005 campaign (-.00302). How bad was that? Manny Ramirez rated better (-.00301). There were only three players in the PMR model that did worse than Burrell, and one of those was future Phillie Dellucci. Ouch. I’ll be eager to see what Plus / Minus has to say given that we are unsure at the moment of the data. I’ll bet that Burrell rates a -10 or -15.
Over in right field, the story didn’t get much better. Bobby Abreu the Phillies Gold Glove-winning right fielder in 2005 posted a +.00010 for 2006, down from his .00148 in ’05. Abreu’s Gold Glove was a very embarrassing moment for baseball, giving an award for a performance that defied what the data told us and what the fans who simply watched the game knew in their hearts. Mercifully that was not repeated in 2006, but now that Abreu plays in New York, expect the media to fawn over his defensive prowess.
On to the infield:
First up, David Bell, the Phillies former third baseman and much maligned and praised figure on this blog. As I always note, David Bell was a weak offensive performer and a strong defensive presence in the Phillies lineup. PMR gives him some nice marks:
PMR: +.00347
Solid, much a major decline from his 2005 numbers: +.01260 …I think you can see that decline playing out in his Plus / Minus numbers as well. Remember, Bell went from +24 in 2005 to just +8 in 2006. Bell’s replacement, Abraham Nunez, has an interesting story to tell through as PMR. As I noted in my Monday column, we don’t know how many of the Phillies performed because some of the individual Plus / Minus data isn’t available yet. We can safely say that Abraham Nunez will rate badly on Plus / Minus, if his PMR is any judge. Consider the differences from 2005 to 2006:
2005: +.01234
2006: -.00128
Nunez went from being in the top third of defensive third basemen to being in the bottom third. I can virtually guarantee that Nunez will rate badly when the PMR numbers emerge.
Moving over to second base … Chase Utley ranks third in Plus / Minus with a sterling +19 at second base. PMR is a little less enthusiastic about Chase, although he rates well, a little out of the top third: +.00383 … Chase rated much, much better in 2005: +.01478, a season where he posted a +26 in Plus / Minus …
At first base we have 2006 N.L. MVP Ryan Howard. Ryan will be happy that almost nobody cares about how well a first baseman fields, because he might have lost the MVP if voters factored defense: Ryan’s -.00631 PMR was the fifth-worst in the majors. Pujols? He was the second-best, with a +.00998. Again PMR and Plus / Minus are in agreement about something: in 2005 PMR rated Ryan Howard as being a terrific defensive first baseman, with a +.00612, which was actually better than Albert Pujols +.00557 … Ryan’s ’05 and ’06 Plus / Minus numbers are a wild swing from +16 in 2005 to -8 this season. That drop-off was major and likely a big factor in why the Phillies struggled defensively.
At shortstop is the only place where I see PMR and Plus / Minus departing company. The Phillies have an excellent shortstop, Jimmy Rollins. Plus / Minus gives J.Roll a positive rating at +12, which was seventh in the majors. PMR ranks J.Roll in the bottom third of shortstops at -.00025. Draw your own conclusions.
I like PMR and I like to use it in my blog, but I like stats like Plus / Minus a little more because they are easier to comprehend. However, I do find Dave’s PMR does accurately track how players perform and I find it to be an invaluable tool in evaluating the Phillies.
Wednesday, January 10, 2007
Runnin’ the Bases: How good were the Phillies?
Slight change in plans for today, my planned article on defensive stats will run tomorrow. Anyway, as I mentioned in my posts on the Phillies defense earlier in the week, Santa (a.k.a., my lovely wife) was very good to me this year, giving me both The 2007 Bill James Handbook and The Hardball Times Annual 2007. Santa knows that giving me both items is basically license for me to spend hours pouring over numbers and even more time sitting at a computer screen typing out “Aaron Rowand suc ks” articles again and again. Okay, I don’t really think Aaron Rowand sucks, and I don’t spend that much time at blogging, but it does occupy a big stretch of my day and my wife is pretty low-key about it.
So I tear into the Handbook 2007 and discover that Bill James expanded his section on base-running, the big addition to the 2006 edition. With a year to improve on what he did in 2006, James has given us a much more complex and interesting picture of base-running. I began scribbling down the Phillies stats and looking at how they did in 2006.
As an aside: getting an overall grasp of team base-running is a little difficult because James presents the information as individuals, not in a team format. Are the Phillies as a team better or worse than average? I haven’t a clue, because I don’t have the time to wade through and count up everything. I’m insanely curious to see how the Phillies would stack up vis-à-vis the Dodgers or the Rockies, two teams that utilize small ball tactics like bunting and hit-and-runs to score runs. Are the Dodgers and Rockies good base-running teams? Knowing the answer to that question would help us analyze the success, or lack thereof, of the Dodgers and Rockies small ball strategies.
Anyway, back to the subject at hand.
We can break the Phillies base-runners into three groups. The first are The Good …
Utley: +27
Victorino: +14
Rowand: +13
Abreu: +11
Rollins: +9
Nunez: +3
A little caveat here for Bobby Abreu: his 2006 base-running is based on both the Phillies and the Yankees, so the +11 isn’t attributable to his work with the Phillies entirely.
Maximum respect for Chase Utley. His +27 was second in the majors to the Anaheim Angels Chone Figgens (+28). Chase was on base 262 times in 2006 and scored 37% of the time, one of the better percentages in baseball. He made no base-running outs, was never doubled off, and he advanced from first base to home on nine of his eleven chances. All of that represented an improvement over 2005, when Chase failed to advance from first to home on his three chances, and scored just 28% of the time. Check out how much better of a base-runner Chase turned into:
2005 / 2006
First-to-Third: 6/21 (29%) / 12/28 (43%)
Second-to-Home: 14/21 (67%) / 20/29 (68%)
First-to-Home: 0/3 (0%) / 9/11 (82%)
You’d expect a speedster like J.Roll to do well, and Nunez’s speed is basically the only plus Nunez has going for him. The surprises here for me were Shane Victorino and Aaron Rowand. I would never have pegged either one as a great base-runner, but there they both are.
Shane got on base 178 times in 2006 and scored 35% of the time. He was +14, which was in the Top 25 of the league, and he moved well, going from First-to-Home four of six chances, from Second-to-Home seven out of ten tries, and from First-to-Third seven of nineteen tries. Shane was doubled off once.
Aaron Rowand was very aggressive and did a nice job in 2006. Aaron got on base 153 times in 2006 and scored 30% of the time, which was good. Aaron got from First-to-Home two of four chances, from Second-to-Home four out of five tries, and from First-to-Third an impressive ten of sixteen tries. Aaron was doubled off once. Aaron’s skill at going from first to third is very impressive: his 63% was much better than the Mariners Ichiro Suzuki (10-for-36, 28%), better than Chase (43%), and better than Derek Jeter (9-for-36, 25%). The Mets Carlos Beltran, a very good base-runner, was just nine-of-twenty going from first-to-third, or 45%. That was also better than he did in 2005, when he was ten-for-twenty-seven. Aaron does good things on the base-paths. If only he’d get there with more frequency.
And then there were The Bad …
Fasano: -10
Lieberthal: -10
Conine: -6
Bell: -3
Coste: -2
James writes in the base-running section of The Handbook: “you would expect the worst baserunners to be mostly catchers and first basemen and DHs.” Coste, Fasnao and Lieberthal are all catchers, Bell was a slow third baseman who grounded into a lot of double plays (18 in ’06, 24 in ’05), and Conine was a slow-footed outfielder who actually played mostly first base for the Orioles. So surprises here. Naturally, the numbers up here are a little suspect given that Fasano and Bell were both dealt during the season to other teams and Conine came from the Orioles, so three of the five guys here did not play all 162 games with the Phillies.
Coste I will single out as a bit of a disappointment: he pretty much failed to advance at every chance he got. I figured that he’d be a better base-runner. C’est la vie.
And finally, the Ugly …
Howard: -21
Burrell: -20
Let’s start with Pat Burrell. The good news was that he was not the worst base-runner in baseball. That dishonor goes to the Marlins Josh Willingham at -30. But Pat does rank as the seventh worst. There is little silver lining here. Pat made four base-running outs and was doubled off twice. The season was largely a continuation of Pat’s struggles running the bases:
2005 / 2006
First-to-Third: 6/15 (40%) / 5/20 (25%)
Second-to-Home: 6/16 (38%) / 10/22 (45%)
First-to-Home: 0/8 (0%) / 0/4 (0%)
He was 0-for-12 going from first to home in two years. Chase did that nine times last season alone. Ouch.
Thankfully for Pat, Ryan Howard was worse. Not surprisingly, Ryan scored just 18% of the time he got on base, more a testament to the weakness of the Phillies hitting behind him (Aaron Rowand, Shane Victorino, Abraham Nunez) than to Ryan’s meager base-running skills. And meager they are. Ryan was doubled off twice, made four base-running outs and generally did a terrible job – with one exception – of advancing on the base-paths:
2005 / 2006
First-to-Third: 2/14 (14%) / 4/24 (17%)
Second-to-Home: 6/11 (55%) / 9/16 (56%)
First-to-Home: 2/4 (50%) / 8/14 (57%)
I’d actually categorize Pat Burrell as being a much worse base-runner than Ryan Howard. Pat is weak in pretty much every facet of the game, while Ryan has some strengths: displaying surprising speed going from first to home. Ryan also didn’t make a base-running out in 2005, while Pat made five.
Chris Roberson, Michael Bourn and Carlos Ruiz were not listed, as they did not get on base the requisite fifty or more times.
So what does all of this mean? With the Phillies Big Bang style of offense, base-running isn’t as vital to the Phillies offense as it would be to the Los Angeles Dodgers or the Colorado Rockies, two teams that hit-and-run and bunt and steal bases to score runs. E.g., in 2006 the Phillies had runners moving 69 times when the pitch was thrown, far less than the Dodgers (137) and the Rocks (109). The Phillies moved the runners with their 216 home runs and their .180 ISO, so having Pat Burrell slipping and sliding hurt the Phillies far less than had the Dodgers Furcal posted a -20 base-running number.
One surprise to me actually was how many good base-runners the Phillies have: Utley, Victorino, Rowand and J.Roll. They are good at running the bases and help the Phillies manufacture runs. In fact, I’d note that in his new section on Manufacturing Runs (starting on page 315), James ranked the Phillies third in the N.L. in type-two manufactured runs, the type derived from infield hits and base-running. The Phillies had 115 MR-2 runs, just six behind the N.L.-leading Cardinals. This does seem to suggest a hidden strength for the Phillies is their base-running. Sure they have two of the worst in the biz on their team in Ryan Howard and Pat Burrell, but they have terrific speed on the base in many of their other players.
So is base-running a hidden strength for the Phillies? I’d be curious to hear your thoughts
(3) comments
 ks” articles again and again. Okay, I don’t really think Aaron Rowand sucks, and I don’t spend that much time at blogging, but it does occupy a big stretch of my day and my wife is pretty low-key about it.
So I tear into the Handbook 2007 and discover that Bill James expanded his section on base-running, the big addition to the 2006 edition. With a year to improve on what he did in 2006, James has given us a much more complex and interesting picture of base-running. I began scribbling down the Phillies stats and looking at how they did in 2006.
As an aside: getting an overall grasp of team base-running is a little difficult because James presents the information as individuals, not in a team format. Are the Phillies as a team better or worse than average? I haven’t a clue, because I don’t have the time to wade through and count up everything. I’m insanely curious to see how the Phillies would stack up vis-à-vis the Dodgers or the Rockies, two teams that utilize small ball tactics like bunting and hit-and-runs to score runs. Are the Dodgers and Rockies good base-running teams? Knowing the answer to that question would help us analyze the success, or lack thereof, of the Dodgers and Rockies small ball strategies.
Anyway, back to the subject at hand.
We can break the Phillies base-runners into three groups. The first are The Good …
Utley: +27
Victorino: +14
Rowand: +13
Abreu: +11
Rollins: +9
Nunez: +3
A little caveat here for Bobby Abreu: his 2006 base-running is based on both the Phillies and the Yankees, so the +11 isn’t attributable to his work with the Phillies entirely.
Maximum respect for Chase Utley. His +27 was second in the majors to the Anaheim Angels Chone Figgens (+28). Chase was on base 262 times in 2006 and scored 37% of the time, one of the better percentages in baseball. He made no base-running outs, was never doubled off, and he advanced from first base to home on nine of his eleven chances. All of that represented an improvement over 2005, when Chase failed to advance from first to home on his three chances, and scored just 28% of the time. Check out how much better of a base-runner Chase turned into:
2005 / 2006
First-to-Third: 6/21 (29%) / 12/28 (43%)
Second-to-Home: 14/21 (67%) / 20/29 (68%)
First-to-Home: 0/3 (0%) / 9/11 (82%)
You’d expect a speedster like J.Roll to do well, and
 Nunez’s speed is basically the only plus Nunez has going for him. The surprises here for me were Shane Victorino and Aaron Rowand. I would never have pegged either one as a great base-runner, but there they both are.
Shane got on base 178 times in 2006 and scored 35% of the time. He was +14, which was in the Top 25 of the league, and he moved well, going from First-to-Home four of six chances, from Second-to-Home seven out of ten tries, and from First-to-Third seven of nineteen tries. Shane was doubled off once.
Aaron Rowand was very aggressive and did a nice job in 2006. Aaron got on base 153 times in 2006 and scored 30% of the time, which was good. Aaron got from First-to-Home two of four chances, from Second-to-Home four out of five tries, and from First-to-Third an impressive ten of sixteen tries. Aaron was doubled off once. Aaron’s skill at going from first to third is very impressive: his 63% was much better than the Mariners Ichiro Suzuki (10-for-36, 28%), better than Chase (43%), and better than Derek Jeter (9-for-36, 25%). The Mets Carlos Beltran, a very good base-runner, was just nine-of-twenty going from first-to-third, or 45%. That was also better than he did in 2005, when he was ten-for-twenty-seven. Aaron does good things on the base-paths. If only he’d get there with more frequency.
And then there were The Bad …
Fasano: -10
Lieberthal: -10
Conine: -6
Bell: -3
Coste: -2
James writes in the base-running section of The Handbook: “you would expect the worst baserunners to be mostly catchers and first basemen and DHs.” Coste, Fasnao and Lieberthal are all catchers, Bell was a slow third baseman who grounded into a lot of double plays (18 in ’06, 24 in ’05), and Conine was a slow-footed outfielder who actually played mostly first base for the Orioles. So surprises here. Naturally, the numbers up here are a little suspect given that Fasano and Bell were both dealt during the season to other teams and Conine came from the Orioles, so three of the five guys here did not play all 162 games with the Phillies.
Coste I will single out as a bit of a disappointment: he pretty much failed to advance at every chance he got. I figured that he’d be a better base-runner. C’est la vie.
And finally, the Ugly …
Howard: -21
Burrell: -20
Let’s start with Pat Burrell. The good news was that he was not the worst base-runner in baseball. That dishonor goes to the Marlins Josh Willingham at -30. But Pat does rank as the seventh worst. There is little silver lining here. Pat made four base-running outs and was doubled off twice. The season was largely a continuation of Pat’s struggles running the bases:
2005 / 2006
First-to-Third: 6/15 (40%) / 5/20 (25%)
Second-to-Home: 6/16 (38%) / 10/22 (45%)
First-to-Home: 0/8 (0%) / 0/4 (0%)
He was 0-for-12 going from first to home in two years. Chase did that nine times last season alone. Ouch.
Thankfully for Pat, Ryan Howard was worse. Not surprisingly, Ryan scored just 18% of the time he got on base, more a testament to the weakness of the Phillies hitting behind him (Aaron Rowand, Shane Victorino, Abraham Nunez) than to Ryan’s meager base-running skills. And meager they are. Ryan was doubled off twice, made four base-running outs and generally did a terrible job – with one exception – of advancing on the base-paths:
2005 / 2006
First-to-Third: 2/14 (14%) / 4/24 (17%)
Second-to-Home: 6/11 (55%) / 9/16 (56%)
First-to-Home: 2/4 (50%) / 8/14 (57%)
I’d actually categorize Pat Burrell as being a much worse base-runner than Ryan Howard. Pat is weak in pretty much every facet of the game, while Ryan has some strengths: displaying surprising speed going from first to home. Ryan also didn’t make a base-running out in 2005, while Pat made five.
Chris Roberson, Michael Bourn and Carlos Ruiz were not listed, as they did not get on base the requisite fifty or more times.
So what does all of this mean? With the Phillies Big Bang style of offense, base-running isn’t as vital to the Phillies offense as it would be to the Los Angeles Dodgers or the Colorado Rockies, two teams that hit-and-run and bunt and steal bases to score runs. E.g., in 2006 the Phillies had runners moving 69 times when the pitch was thrown, far less than the Dodgers (137) and the Rocks (109). The Phillies moved the runners with their 216 home runs and their .180 ISO, so having Pat Burrell slipping and sliding hurt the Phillies far less than had the Dodgers Furcal posted a -20 base-running number.
One surprise to me actually was how many good base-runners the Phillies have: Utley, Victorino, Rowand and J.Roll. They are good at running the bases and help the Phillies manufacture runs. In fact, I’d note that in his new section on Manufacturing Runs (starting on page 315), James ranked the Phillies third in the N.L. in type-two manufactured runs, the type derived from infield hits and base-running. The Phillies had 115 MR-2 runs, just six behind the N.L.-leading Cardinals. This does seem to suggest a hidden strength for the Phillies is their base-running. Sure they have two of the worst in the biz on their team in Ryan Howard and Pat Burrell, but they have terrific speed on the base in many of their other players.
So is base-running a hidden strength for the Phillies? I’d be curious to hear your thoughts
Tuesday, January 09, 2007
New Defensive Metrics, Part II...
As  I noted yesterday, a lot of the new data we have regarding 2006 fielding stats is shedding a lot of light on how the Phillies struggled defensively in 2006, just a year removed from a season where they were the strongest defensive team in baseball. The Phillies -33 Plus / Minus came a year after the team posted an astonishing +108, a swing of 141 plays against the ’06 squad.
I argued that the big blow to the quality of the Phillies defense seemed to be the decline in play for David Bell, Abraham Nunez and Ryan Howard, the Phillies corner infielders, whose play swung from +57 in 2005 to -17 in 2006, a swing of 74 plays alone. The Phillies middle infield was excellent again, posting a +32 a season after they posted a +50, a decline of just 18 plays.
So the decline in the Phillies infield play accounts for 92 of the 141 plays, so where do the last 49 come from? The Phillies outfield.
Over the last several years, while the Phillies have had sterling play from their infield defensively, the Phillies haven’t exactly been blessed with sparkling outfield play. For the last several years the Phillies outfield has consisted of Pat Burrell, a solid fielder with a good arm but bad range, and Bobby Abreu, a player who looked more like he was concentrating on what he planned to do when he came to bat in the next inning then someone who bothered to play attention to his fielding skills. Abreu and Burrell have been supplemented with a rotating crop of center fielders.
Even in a season (2005) where they lead the majors in plus / minus by a hefty margin, the Phillies had average outfield play. The Phillies 2005 outfield posted a +1, which ranked them seventh in the National League. Looking to bolster the weakest part of what had been a major strength for the team, the Phillies traded for Aaron Rowand, the center fielder who led all CFs in 2005 with a stunning +30 Plus / Minus. So with Rowand playing and with Abreu dealt, the Phillies improved on their ’05 +1, right?
Wrong, the Phillies fell to -48, a 49 play swing which placed them dead-last in the National League. (The only team worse than the Phillies in the majors in outfield plus / minus were the Boston Red Sox and their Manny Ramirez-induced -69.) Not that the Phillies had a great history to begin with, but the -48 was much worse than their recent past:
(N.L. Rank, of 16 teams)
2006: -48 (16th)
2005: +1 (7th)
2004: -22 (11th)
2003: +9 (4th)
Do we know how the individual players did? In yesterday’s post I was able to extrapolate what Ryan Howard did, but players like Jimmy Rollins, Chase Utley and David Bell all placed in the top ten for their positions, so we know, generally, how they did. We’ll have to wait until John Dewan published the Plus / Minus data in a revised Fielding Bible to know if I am correct in assuming that Abraham Nunez was a major drag on the Phillies defense in 2006.
Things are a little more complicated for the ’06 outfield because none of them did well. Nobody posted in the top ten of their position, and none of the Phillies posted in the top ten for the last three years, so we cannot extrapolate … save one player, Aaron Rowand.
As I noted, the Phillies traded from Rowand thinking that Rowand was going to be the missing piece of the puzzle. Rowand was nothing short of spectacular in 2005, earning the praise of The Fielding Bible, which said of him: “[Rowand] shows excellent play in center utilizing great reads and good jumps. Rowand plays with reckless abandon.” Rowand also ranked fourth in throwing, allowing just .496 runners to advance, a good percentage behind MLB leader Jim Edmonds at .410. Since Rowand appears in the ’04 – ’06 top ten at +31, we can extrapolate his plus / minus for ’06 by subtracting the +5 he had in ’04 and the +30 in ’05, which leaves us at -4.
Was Rowand hampered by some sort of long-term, lingering injury that impacted his 2006 play? I hope so, because the Phillies did not get Aaron Rowand for his bat. They got him for his glove, and -4 isn’t going to cut it. Here are Rowand’s ’03 – ’06 stats:
Aaron Rowand:
2003: -1
2004: +5
2005: +30
2006: -4
’03 – ’06: +30
But what about the rest of the team? Rowand was just -4. There is still another -44 out there. We can safely say that Burrell and Abreu were each probably in the negative range, perhaps even -15 or worse, but they couldn’t have been alone. Bobby Abreu only played 58% of the Phillies defensive innings. Burrell played 68% and was frequently removed for defensive purposes in favor of David Dellucci and Shane Victorino. Neither Burrell nor Abreu played well in 2006, though Burrell has profiled well in the past.
(The Gold Glove given to Abreu in 2005 is still the source of a lot of embarrassment for baseball, much the say way the Academy Awards still get flack for giving Marissa Tomei the Oscar for “My Cousin Vinny”.)
I am curious about Dellucci, a player who earned praise from John Dewan in The Fielding Bible for his enthusiasm and hustle, but Victorino is the interesting case and I am very eager to see how Dewan’s Plus / Minus rated him. He played 101 innings in left field, 558 in center field, and another 156 in right field in 2006, meaning he played 56% of the Phillies defensive innings. I suspect that Victorino will profile well with Plus / Minus – he has good speed and seems to have good instincts – and that his throwing skills will be second-to-nine (he logged eleven assists in 2006. In one-sixth the time it took Bobby Abreu to log four assists in right, Victorino had three), but the tremendously bad Plus / Minus the Phillies outfield had in 2006 makes me believe that Victorino will surprise me and come back with a negative rating.
The Phillies did a so-so job holding base-runners in 2006, allowing .524 to advance, seventh in the N.L. This was a significant decline from the Phillies N.L.-leading .435 in 2005. That season Jason Michaels, who now plays for the Indians and posted a sterling +12 this season by the way, was baseball’s second-best center fielder in holding runners (.442), while Bobby Abreu and Pat Burrell placed outside of the top ten. This is an area where I wonder what sort of an impact Shane Victorino and Rowand had in 2006.
The bottom-line is that the data clearly shows that the Phillies outfield played some lousy, atrocious baseball in 2006. This unit will have to improve and improve greatly in 2007 for the Phillies to make it into the playoffs. The picture that I painted in my Season in Review in November and the picture I saw emerge from the pages of The Bill James Handbook and The Hardball Times Annual are nearly the same, but the data I have seen paints a starker picture: the 2006 Phillies went from a terrific defensive team to a lousy one. The drop in defense probably cost the Phillies 40-50 runs this season and likely cost them a few baseball games. Want to know why the Phillies failed to make the playoffs? That’s it. This team needs to play better D or it will watch the Mets celebrate once more.
Tomorrow I’ll move a little away from the books and discuss what other systems like Dave Pinto’s Probablistic Model of Range (PMR) have to say about the Phillies defense in relation to Plus / Minus and the rest of it.
(2) comments
 I noted yesterday, a lot of the new data we have regarding 2006 fielding stats is shedding a lot of light on how the Phillies struggled defensively in 2006, just a year removed from a season where they were the strongest defensive team in baseball. The Phillies -33 Plus / Minus came a year after the team posted an astonishing +108, a swing of 141 plays against the ’06 squad.
I argued that the big blow to the quality of the Phillies defense seemed to be the decline in play for David Bell, Abraham Nunez and Ryan Howard, the Phillies corner infielders, whose play swung from +57 in 2005 to -17 in 2006, a swing of 74 plays alone. The Phillies middle infield was excellent again, posting a +32 a season after they posted a +50, a decline of just 18 plays.
So the decline in the Phillies infield play accounts for 92 of the 141 plays, so where do the last 49 come from? The Phillies outfield.
Over the last several years, while the Phillies have had sterling play from their infield defensively, the Phillies haven’t exactly been blessed with sparkling outfield play. For the last several years the Phillies outfield has consisted of Pat Burrell, a solid fielder with a good arm but bad range, and Bobby Abreu, a player who looked more like he was concentrating on what he planned to do when he came to bat in the next inning then someone who bothered to play attention to his fielding skills. Abreu and Burrell have been supplemented with a rotating crop of center fielders.
Even in a season (2005) where they lead the majors in plus / minus by a hefty margin, the Phillies had average outfield play. The Phillies 2005 outfield posted a +1, which ranked them seventh in the National League. Looking to bolster the weakest part of what had been a major strength for the team, the Phillies traded for Aaron Rowand, the center fielder who led all CFs in 2005 with a stunning +30 Plus / Minus. So with Rowand playing and with Abreu dealt, the Phillies improved on their ’05 +1, right?
Wrong, the Phillies fell to -48, a 49 play swing which placed them dead-last in the National League. (The only team worse than the Phillies in the majors in outfield plus / minus were the Boston Red Sox and their Manny Ramirez-induced -69.) Not that the Phillies had a great history to begin with, but the -48 was much worse than their recent past:
(N.L. Rank, of 16 teams)
2006: -48 (16th)
2005: +1 (7th)
2004: -22 (11th)
2003: +9 (4th)
Do we know how the individual players did? In yesterday’s post I was able to extrapolate what Ryan Howard did, but players like Jimmy Rollins, Chase Utley and David Bell all placed in the top ten for their positions, so we know, generally, how they did. We’ll have to wait until John Dewan published the Plus / Minus data in a revised Fielding Bible to know if I am correct in assuming that Abraham Nunez was a major drag on the Phillies defense in 2006.
Things are a little more complicated for the ’06 outfield because none of them did well. Nobody posted in the top ten of their position, and none of the Phillies posted in the top ten for the last three years, so we cannot extrapolate … save one player, Aaron Rowand.
As I noted, the Phillies traded from Rowand thinking that Rowand was going to be the missing piece of the puzzle. Rowand was nothing short of spectacular in 2005, earning the praise of The Fielding Bible, which said of him: “[Rowand] shows excellent play in center utilizing great reads and good jumps. Rowand plays with reckless abandon.” Rowand also ranked fourth in throwing, allowing just .496 runners to advance, a good percentage behind MLB leader Jim Edmonds at .410. Since Rowand appears in the ’04 – ’06 top ten at +31, we can extrapolate his plus / minus for ’06 by subtracting the +5 he had in ’04 and the +30 in ’05, which leaves us at -4.
Was Rowand hampered by some sort of long-term, lingering injury that impacted his 2006 play? I hope so, because the Phillies did not get Aaron Rowand for his bat. They got him for his glove, and -4 isn’t going to cut it. Here are Rowand’s ’03 – ’06 stats:
Aaron Rowand:
2003: -1
2004: +5
2005: +30
2006: -4
’03 – ’06: +30
But what about the rest of the team? Rowand was just -4. There is still another -44 out there. We can safely say that Burrell and Abreu were each probably in the negative range, perhaps even -15 or worse, but they couldn’t have been alone. Bobby Abreu only played 58% of the Phillies defensive innings. Burrell played 68% and was frequently removed for defensive purposes in favor of David Dellucci and Shane Victorino. Neither Burrell nor Abreu played well in 2006, though Burrell has profiled well in the past.
(The Gold Glove given to Abreu in 2005 is still the source of a lot of embarrassment for baseball, much the say way the Academy Awards still get flack for giving Marissa Tomei the Oscar for “My Cousin Vinny”.)
I am curious about Dellucci, a player who earned praise from John Dewan in The Fielding Bible for his enthusiasm and hustle, but Victorino is the interesting case and I am very eager to see how Dewan’s Plus / Minus rated him. He played 101 innings in left field, 558 in center field, and another 156 in right field in 2006, meaning he played 56% of the Phillies defensive innings. I suspect that Victorino will profile well with Plus / Minus – he has good speed and seems to have good instincts – and that his throwing skills will be second-to-nine (he logged eleven assists in 2006. In one-sixth the time it took Bobby Abreu to log four assists in right, Victorino had three), but the tremendously bad Plus / Minus the Phillies outfield had in 2006 makes me believe that Victorino will surprise me and come back with a negative rating.
The Phillies did a so-so job holding base-runners in 2006, allowing .524 to advance, seventh in the N.L. This was a significant decline from the Phillies N.L.-leading .435 in 2005. That season Jason Michaels, who now plays for the Indians and posted a sterling +12 this season by the way, was baseball’s second-best center fielder in holding runners (.442), while Bobby Abreu and Pat Burrell placed outside of the top ten. This is an area where I wonder what sort of an impact Shane Victorino and Rowand had in 2006.
The bottom-line is that the data clearly shows that the Phillies outfield played some lousy, atrocious baseball in 2006. This unit will have to improve and improve greatly in 2007 for the Phillies to make it into the playoffs. The picture that I painted in my Season in Review in November and the picture I saw emerge from the pages of The Bill James Handbook and The Hardball Times Annual are nearly the same, but the data I have seen paints a starker picture: the 2006 Phillies went from a terrific defensive team to a lousy one. The drop in defense probably cost the Phillies 40-50 runs this season and likely cost them a few baseball games. Want to know why the Phillies failed to make the playoffs? That’s it. This team needs to play better D or it will watch the Mets celebrate once more.
Tomorrow I’ll move a little away from the books and discuss what other systems like Dave Pinto’s Probablistic Model of Range (PMR) have to say about the Phillies defense in relation to Plus / Minus and the rest of it.
Monday, January 08, 2007
New Defensive Metrics, Part I...
As I noted in my Primer post a few days back, fielding is sort of my niche, my specialty within the Phillies blogging universe. I am fascinated with the subject because it is so complicated and unknown, the undiscovered country of sabremetrics. So you can imagine my delight when Santa Claus (a.k.a., my darling wife) gave me The Bill James Handbook 2007 and The Hardball Times Baseball Annual 2007 for Christmas. To be sure I will be posting reviews of both in the coming days, but in the here and now I am most interested in what both books have to say about the Phillies defense in 2006. So … the first thing that I noticed in The Hardball Times Annual was that John Dewan published his 2006 team defense ratings which contained a wealth of data and a clear picture about the Phillies fielding foibles in 2006.
Dewan is the author of The Fielding Bible, a book published last year that did a lot to revolutionize our understanding of fielding in baseball and gave people much to argue about last off-season. Dewan, the head of Baseball Information Solutions, gives the information to baseball teams to allow them to evaluate their defense and only publishes the information at the end of the off-season. (Last season I believe it was published in February or so.) Plus / Minus, Dewan’s system for evaluating individual players, evaluates how many plays above (or below) average a player made in the season.
Let’s start with the team performance …
Overall the Phillies were -33 in Plus/Minus is 2006, placing them 13 th of 16 N.L. teams. Mercifully for the Phillies, the Washington Nationals (-38), the Cincinnati Reds (-61), and the Pittsburgh Pirates (-77) were worse at defense. The Pirates in particular are a tale of misery: defense is an undervalued asset in baseball, so a team looking to improve while not spending much money might look at defense as a tonic for what ails them, yet the Pirates don’t. While being respectable in 2005, the Pirates were again the N.L.’s worst defensive team in 2004 at -44.
So the Phillies struggled defensively in 2006. Why is this a big deal Mike?
Because they have traditionally been one of the better defensive teams in baseball. Check out their plus / minus and rank the last three seasons:
(N.L. rank, of 16 teams)
2006: -33 (13th)
2005: +108 (1st)
2004: +18 (6th)
2003: +31 (5th)
The 2005 Phillies weren’t merely good that season, they were out of sight: they were 39 plays better than the MLB’s second-place team, the Cleveland Indians. They were 58 plays better than the #2 N.L. team, the Houston Astros. They were awesome. 1929 Philadelphia A's awesome.
Which is why the Phillies breakdown in 2006 was really the story of the season. The -33 was a swing of 141 plays, or nearly a play a game. Sure, perhaps a bloop single landed in here and there to extend an inning a batter, but some of those were plays that could have saved runs. Assuming that every other play resulted in a run, you’d have to say that the Phillies defense swung 70 runs from ’05 to ’06. The defensive breakdown put a lot of stress on the pitching staff and forced the Phillies to play a lot of catch up.
What do we know about the Phillies individual performers? Well, in 2005 the Phillies had a lot of superstars on defense. David Bell was the best third baseman at +24, Chase Utley was second at second base in Plus/Minus at +26, Jimmy Rollins was fourth at short at +23, and Ryan Howard, not exactly someone you’d mention for a gold glove at first, was +16, second in the league. Simply put, the Phillies infield defense was spectacular. Combined they were +107, and the Phillies ranked first in corner infield (+57) and middle infield (+50).
That changed somewhat in 2006: the Phillies still rated well up the middle, posting a +32 in middle infield defense, but they dropped to -17, thirteenth in the N.L., on the corners. I tried to figure out why this decline happened and I had a few ideas:
Picking up The Bill James Handbook, I saw that John Dewan listed the top ten players at each position in 2006 and for the last three years. Since most of the Phillies ranked in the top ten in the ’04 – ’06 era, I very quickly figured out the problem:
For all of his success in 2006 with his bat, Ryan Howard was an atrocious fielder. After being +16 in 2005, he was -8 in 2006, a swing of 24 plays, and a good deal of the reason why the Phillies rated to poorly.
But that doesn’t fully explain the swing of 74 plays in the corner infield from ’05 to ’06. While David Bell wasn’t as good (+8, tied for eighth in the MLB), I suspect that Abraham Nunez played terrible baseball for the Phillies at third base. We don’t know what percentage of Bell’s +8 come from his performance with the Phillies and what with the Brewers after his trade there, but it seems reasonable to assume that Nunez lousy play is largely responsible for the Phillies struggles. I suppose we shall see what the 2007 Fielding Bible is published, or John Dewan makes the 2006 Plus / Minus data public.
Chase Utley continued to impress: his +19 was third in the MLB, and Jimmy Rollins +12 was seventh. Clearly, the Phillies are strong up the middle and weaker on the corners. Let’s hope Wes Helms has a good glove.
Here’s how the Phillies have ranked in corner and middle defense for the last several seasons:
Middle Infield / Corner Infield (N.L. rank, of 16 teams)
2006: +32 (3rd) / -17 (13th)
2005: +50 (1st) / +57 (1st)
2004: +10 (6th) / +30 (2nd)
2003: +35 (2nd) / -13 (10th)
’03 – ’06: +127 / +57
John Dewan also rates how the Phillies did defending against bunts and in turning the double play. The information is interesting stuff:
With the decline of the Phillies corner infield it is perhaps not that surprising that the Phillies rated fifteenth of sixteen N.L. teams in defending against bunts with a .513 average. This is not, however, an area where the Phillies have traditionally excelled. They were twelfth in 2005 at .504, even in a season where the team was +57 on the corner. Their best showing between ’03 & ’06 was in ’04, when they were seventh at .556.
What did surprise me was in the Phillies success in turning the double play: the Phillies ranked third of sixteen teams at .420 in turning the GDP. This was an improvement:
(N.L. rank, of 16 teams)
2006: .420 (3rd)
2005: .387 (7th)
2004: .364 (8th)
2003: .424 (2nd)
I think the ’06 campaign represented Chase Utley’s maturation as a player. In addition to having a strong season at the plate he continued to be a strong fielder and improved on a phase of the game where he struggled in 2005, namely in turning the double play pivot. I think we may assume that the Phillies success in turning GDP’s was a product of Chase developing his skills further in the field.
That is all for today, tomorrow we’ll discuss outfield defense a little more …
(2) comments
 days, but in the here and now I am most interested in what both books have to say about the Phillies defense in 2006. So … the first thing that I noticed in The Hardball Times Annual was that John Dewan published his 2006 team defense ratings which contained a wealth of data and a clear picture about the Phillies fielding foibles in 2006.
Dewan is the author of The Fielding Bible, a book published last year that did a lot to revolutionize our understanding of fielding in baseball and gave people much to argue about last off-season. Dewan, the head of Baseball Information Solutions, gives the information to baseball teams to allow them to evaluate their defense and only publishes the information at the end of the off-season. (Last season I believe it was published in February or so.) Plus / Minus, Dewan’s system for evaluating individual players, evaluates how many plays above (or below) average a player made in the season.
Let’s start with the team performance …
Overall the Phillies were -33 in Plus/Minus is 2006, placing them 13 th of 16 N.L. teams. Mercifully for the Phillies, the Washington Nationals (-38), the Cincinnati Reds (-61), and the Pittsburgh Pirates (-77) were worse at defense. The Pirates in particular are a tale of misery: defense is an undervalued asset in baseball, so a team looking to improve while not spending much money might look at defense as a tonic for what ails them, yet the Pirates don’t. While being respectable in 2005, the Pirates were again the N.L.’s worst defensive team in 2004 at -44.
So the Phillies struggled defensively in 2006. Why is this a big deal Mike?
Because they have traditionally been one of the better defensive teams in baseball. Check out their plus / minus and rank the last three seasons:
(N.L. rank, of 16 teams)
2006: -33 (13th)
2005: +108 (1st)
2004: +18 (6th)
2003: +31 (5th)
The 2005 Phillies weren’t merely good that season, they were out of sight: they were 39 plays better than the MLB’s second-place team, the Cleveland Indians. They were 58 plays better than the #2 N.L. team, the Houston Astros. They were awesome. 1929 Philadelphia A's awesome.
Which is why the Phillies breakdown in 2006 was really the story of the season. The -33 was a swing of 141 plays, or nearly a play a game. Sure, perhaps a bloop single landed in here and there to extend an inning a batter, but some of those were plays that could have saved runs. Assuming that every other play resulted in a run, you’d have to say that the Phillies defense swung 70 runs from ’05 to ’06. The defensive breakdown put a lot of stress on the pitching staff and forced the Phillies to play a lot of catch up.
What do we know about the Phillies individual performers? Well, in 2005 the Phillies had a lot of superstars on defense. David Bell was the best third baseman at +24, Chase Utley was second at second base in Plus/Minus at +26, Jimmy Rollins was fourth at short at +23, and Ryan Howard, not exactly someone you’d mention for a gold glove at first, was +16, second in the league. Simply put, the Phillies infield defense was spectacular. Combined they were +107, and the Phillies ranked first in corner infield (+57) and middle infield (+50).
That changed somewhat in 2006: the Phillies still rated well up the middle, posting a +32 in middle infield defense, but they dropped to -17, thirteenth in the N.L., on the corners. I tried to figure out why this decline happened and I had a few ideas:
Picking up The Bill James Handbook, I saw that John Dewan listed the top ten players at each position in 2006 and for the last three years. Since most of the Phillies ranked in the top ten in the ’04 – ’06 era, I very quickly figured out the problem:
For all of his success in 2006 with his bat, Ryan Howard was an atrocious fielder. After being +16 in 2005, he was -8 in 2006, a swing of 24 plays, and a good deal of the reason why the Phillies rated to poorly.
But that doesn’t fully explain the swing of 74 plays in the corner infield from ’05 to ’06. While David Bell wasn’t as good (+8, tied for eighth in the MLB), I suspect that Abraham Nunez played terrible baseball for the Phillies at third base. We don’t know what percentage of Bell’s +8 come from his performance with the Phillies and what with the Brewers after his trade there, but it seems reasonable to assume that Nunez lousy play is largely responsible for the Phillies struggles. I suppose we shall see what the 2007 Fielding Bible is published, or John Dewan makes the 2006 Plus / Minus data public.
Chase Utley continued to impress: his +19 was third in the MLB, and Jimmy Rollins +12 was seventh. Clearly, the Phillies are strong up the middle and weaker on the corners. Let’s hope Wes Helms has a good glove.
Here’s how the Phillies have ranked in corner and middle defense for the last several seasons:
Middle Infield / Corner Infield (N.L. rank, of 16 teams)
2006: +32 (3rd) / -17 (13th)
2005: +50 (1st) / +57 (1st)
2004: +10 (6th) / +30 (2nd)
2003: +35 (2nd) / -13 (10th)
’03 – ’06: +127 / +57
John Dewan
 also rates how the Phillies did defending against bunts and in turning the double play. The information is interesting stuff:
With the decline of the Phillies corner infield it is perhaps not that surprising that the Phillies rated fifteenth of sixteen N.L. teams in defending against bunts with a .513 average. This is not, however, an area where the Phillies have traditionally excelled. They were twelfth in 2005 at .504, even in a season where the team was +57 on the corner. Their best showing between ’03 & ’06 was in ’04, when they were seventh at .556.
What did surprise me was in the Phillies success in turning the double play: the Phillies ranked third of sixteen teams at .420 in turning the GDP. This was an improvement:
(N.L. rank, of 16 teams)
2006: .420 (3rd)
2005: .387 (7th)
2004: .364 (8th)
2003: .424 (2nd)
I think the ’06 campaign represented Chase Utley’s maturation as a player. In addition to having a strong season at the plate he continued to be a strong fielder and improved on a phase of the game where he struggled in 2005, namely in turning the double play pivot. I think we may assume that the Phillies success in turning GDP’s was a product of Chase developing his skills further in the field.
That is all for today, tomorrow we’ll discuss outfield defense a little more …
![]()


