Monday, November 06, 2006
2006 Season In Review: Fielding
I consider my season preview / season review posts on Fielding to be the most interesting and informative posts that I do. (Click here to read my 2004 Season in Review for Fielding.) Thus, I consider putting them last because I devote the most time and attention to writing them, but I figure that people aren’t quite as interested and probably wouldn’t read them. My interest in fielding is probably a product of my interest in things and ideas that are out of the mainstream or are considered unorthodox. In the realm of baseball I think that nothing is more unique or unorthodox than fielding. My favorite author, baseball or otherwise, Bill James, wrote: “Hitting is solid, pitching is liquid and defense is gaseous … damned hard to capture, formless and hard to see.” The Washington Post's Tom Boswell described defense as “the cognoscenti corner of baseball, the poorly lighted room in the gallery.” Fielding is the last great frontier of baseball, the last bastion of the misunderstood aspects of the game.
Whenever I see something on television about the latest advances in the field of science I always find myself thinking that I wish I had the ability to think and see that abstractly into a problem and come up with such an innovative understanding of what was involved. I find myself thinking about that a lot these days as I read about the advances in sabremetrics. I would never have thought of that, is what I think as I read about a new way to look at runs created or a new way to evaluate pitchers. These days there are too many ways of looking at old issues. I’ll try to cover as many as I can, but there is simply too much information floating around out there to make use of it all.
Let me start by noting that I said that 2006 was going to be the Year of the Glove for the Phillies because their defensive alignment was going to be vital to their post-season chances. The Phillies had one of the best, if not the best, defense in baseball. They finished second in the National League in Defense Efficiency Ratio (DER)*, just a little behind the Houston Astros, meaning that they were the second-best team in the N.L. in converting balls put into play into outs. As a team they also finished first in the major leagues in Plus / Minus, the system developed by The Fielding Bible’s John Dewan, a t +108, thirty-nine plays better than the second-place Cleveland Indians. I looked at the Phillies and felt that they would be even stronger in 2006: after all, their sole weakness was their outfield, which rated a meager +1 while the Phillies corner infield and middle infield rated +57 and +50. The addition of Aaron Rowand, the former White Sox who led the MLB in Plus / Minus for all center fielders at +30, would be a big improvement over the Jason Michaels / Kenny Lofton platoon, which managed a combined +5 in 2005.
* DER – Defense Efficiency Ratio: (Batters Faced – (Hits + Walks + Hit By Pitch + Strikeouts)) / (Batters Faced – (Home Runs, Walks + Hit By Pitch + Strikeouts)) How often fielders convert balls put into play into outs.
I was certain that the Phillies improved defense would be a major factor in their march to the post-season: consistently over the last several years the Phillies fielders have ranked at the top or near the top in DER and Plus / Minus (the Phillies ranked eighth and tenth in 2004 and 2003), a factor which helps the Phillies pitchers from having a worse ERA than they deserve. By covering up for the Phillies so-so pitching, the Phillies improved fielding will help save more runs and propel the Phillies into the playoff hunt behind their fearsome offense.
I was pretty wrong. First, let me note that we don’t have any Plus / Minus data to look at yet. I presume the updated Fielding Bible will be issued in February, but until then we have to use other stats to look at how the Phillies did in 2006.
As a team, I think we can safely say that the Phillies were much worse in 2006 then they were in seasons past. Consider team Defense Efficiency Ratio (DER):
DER:
1. San Diego: .710
2. New York: .701
3. Houston: .701
4. San Francisco: .700
5. Chicago: .698
6. St. Louis: .697
7. Washington: .689
8. Milwaukee: .685
9. Atlanta: .686
10. Arizona: .685
11. Florida: .683
12. Colorado: .683
13. Los Angeles: .681
14. Philadelphia: .681
15. Cincinnati: .680
16. Pittsburgh: .674
That’s pretty bad, but consider what a decline it represented from 2005, when the Phillies converted .703 balls put into play into outs, good for second-best in the National League. Here are how the Phillies have done in terms of DER for the last six seasons:
2006: .681 / 15th
2005: .703 / 2nd
2004: .702 / 3rd
2003: .701 / 4th
2002: .705 / 4th
2001: .699 / 4th
Wow. Curious to see when was the last time that the Phillies had played this badly on defense, I started exploring from 2000 backwards until I found a time where they were as bad as this. The result?:
2000: .693 / 6th
1999: .695 / 5th
1998: .689 / 8th
1997: .680 / 11th*
* There were fourteen teams that season. The next season the Brewers switched from the American League to the National League and the Arizona Diamondbacks came into being.
I was more than a little startled to see that. The Phillies haven’t been this bad on defense since 1997, ten campaigns ago, when the Phillies outfield consisted of Darren Daulton’s gimpy knees in right field, Gregg Jeffries played in left, and the Phillies center fielders were those noted major leaguers Ricky Otero, Midre Cummings, and Wendell Magee. That was how far the 2006 Phillies had fallen on defense.
We’ll talk about the Outfield first … In 2005 the Phillies had a pretty static situation in their outfield. Pat Burrell played in left, Bobby Abreu played in right and Kenny Lofton and Jason Michaels split time in center, with Michaels moving to left or right whenever a defensive substitution needed to be made. The Phillies outfield defense wasn’t great: the Phillies ranked eighteenth in outfield Plus / Minus.
Right Field: For the Phillies, Bobby Abreu posted a -13 Plus / Minus rating in 2005, making him the twenty-eighth-best rightfielder in baseball, and he held .492 of advancing runners, good for eleventh in the MLB. Despite his mediocrity, Abreu won the 2005 Gold Glove for Right Field, an outcome that provoked a combination of laughter and outrage from phloggers. Abreu played pretty much every game for the Phillies prior to the deal that sent him to the Yankees along with the late Cory Lidle. After Abreu’s departure, the Phillies played Jeff Conine, David Dellucci and Shane Victorino. Here are some of their stats:
Zone Rating / Range Factor / Assists
Bobby Abreu: .873 / 1.94 / 4
David Delluci: .872 / 1.72 / 0
Jeff Conine: .967 / 1.68 / 0
Shane Victorino: .897 / 2.37 / 3
Confused about what I’m talking about? Here are the stats I refer to defined:
Zone Rating (ZR): Is a stat which measures a player’s defensive ability by measuring plays they should have made. Admittedly, this is a stat left open to subjective opinions, but absent Plus / Minus, this is my all-around defensive stat.
Fielding Percentage (FP): (Putouts + Assists) / (Putouts + Assists + Errors). How often the player successfully handled the ball.
Range Factor (RF): (Putouts + Assists) * 9 / IP. Essentially measures how much a player is involved in defensive plays.
To play right field, you’ve got to have a good arm because you need to get the ball from right to the left side of the field to gun down runners advancing to second or third, or home plate. Whatever his mental lapses in fielding the ball, Abreu always had a decent arm. In Shane Victorino, however, I think the Phillies found a player who excels in this area. Check out Assists per 1,000 Innings:
Shane Victorino: 19.23
Bobby Abreu: 4.73
David Delluci: 0
Jeff Conine: 0
We’ll come back to this when we discuss Victorino’s performanc e in left and center, but we can say that Shane’s got a cannon back there. For reasons that I’ll flesh out later, I think the Phillies would be best off handing the 2007 RF job to Shane. He played well and made a lot of solid contributions in right.
Overall, Bobby Abreu played his usual so-so baseball in right in 2006. Had he and Dellucci, qualified with enough innings played, they would have ranked sixth and seventh in NL rightfielders in Zone Rating (out of eleven). Conine would have ranked first, and Victorino would have ranked third in ZR.
Let’s move on … Pat Burrell plays Left Field for the Phillies and I’m just not sure what to make of his performance in 2006. I have no idea how many times he was removed from a game for a defensive substitution, but by my count he played 988 innings in 2006 and started every game he played, which means he logged 7.84 innings a start, i.e., he didn’t play anywhere near the maximum number of innings he could have. In comparison, Bobby Abreu played 846 innings in 95 starts, or 8.90 innings a start. Even though Burrell suffered no major injury during the season, David Dellucci started 31 games in left and Victorino started three. Clearly, the Phillies saw Pat Burrell as some sort of defensive albatross around their necks and treated him as such. Burrell has, to date, actually been a decent defensive outfielder:
Plus / Minus (rank) / Baserunners Held (rank)
2003: +11 (3rd) / .364 (6th)
2004: -2 (19th) / .286 (4th)
2005: +3 (10th) / .354 (13th)
The Fielding Bible describes Burrell as having “a good arm and a quick release”, but that he lacks “great speed or range”. (Page 178.) I think he’s a solid fielder, but I am curious to see if The Fielding Bible for 2007 rates Burrell as having a major defensive slump in 2006. Here were the stats of Burrell and his chief replacements, David Dellucci and Shane Victorino:
Zone Rating / Range Factor / Assists
Pat Burrell: .857 / 1.93 / 8
David Delluci: .897 / 1.93 / 1
Shane Victorino: .846 / 2.14 / 2
Once more, the skill Victorino shows in throwing runners out manifests itself:
Assists per 1,000 Innings:
Shane Victorino: 19.80
Pat Burrell: 8.09
David Delluci: 3.56
To be sure, Zone Rating doesn’t have anything nice to say about Burrell’s skills. He’s a weaker left fielder playing a position where you stick your weakest fielder:
Zone Rating:
1. Roberts (SD): .927
2. Murton: (CHI): .889
3. Soriano (WASH): .876
4. Ethier (LA): .872
5. Holliday (COL): .870
6. Gonzalez (ARI): .867
7. Bonds (SF): .860
8. Burrell (PHI): .857
9. Bay (PIT): .839
10. Dunn (CIN): .815
11. Willingham (FLA): .790
For completeness I’ll note the year-by-year results for Pat:
Zone Rating / Assists / Assists per 1,000 Innings
2006: .857 / 8 / 8.09
2005: .882 / 10 / 7.71
2004: .872 / 9 / 8.49
I suspect that when everything is all said and done that Pat’s throwing arm will rate high for keeping runners held to their bases, but that Pat is probably on the negative side of the ledger in Plus / Minus. Moving on …
The big deal to bring Aaron Rowand to Philly to play Center Field was a move that I felt positive would improve the Phillies defense. Hey, if Rowand went +30 in ’05 and Lofton & Michaels were a combined +5, I figured that Aaron might contribute an extra 10, 12, 15 … maybe 20 plays to the Phillies. That might be an improvement of four or five games right there.
I was definitely wrong. I am very curious to see what Rowand rates, but he spent much of the year last or near-last in Zone Rating. I suspect that he will profile badly in Plus / Minus. Perhaps even a negative number, which means that the Phillies technically downgraded an already weak part of their team – outfield defense. Let’s compare Rowand and Victorino (his replacement after his injury) to Michaels and Lofton in 2005:
Zone Rating / Range Factor / Assists per 1,000 Innings:
Rowand (2006: .857 / 2.57 / 6.65
Victorino (2006): .858 / 2.70 / 10.74
Michaels (2005): .882 / 2.79 / 9.33
Lofton (2005): .876 / 2.53 / 9.45
For the heck of it, I’ll also throw in the Phillies ’04 center field stats:
Marlon Byrd: .846 / 2.38 / 5.31
Jason Michaels: .844 / 2.67 / 3.10
Doug Glanville: .870 / 2.83 / 0.00
Ricky Ledee: .925 / 3.68 / 29.9*
* This result was based on three assists in 100 & 1/3 innings, so it might just be a very small sample size, but still, that Ledee guy was pretty good in ’04 wasn’t he?
 In nearly every aspect, Aaron Rowand was a massive disappointment to the Phillies. Offensively, which is something I’ll explore in Part III, he was a nightmare: a free-swinging easy out. Defensively, his reputation for quickness and having a terrific arm was utterly absent in 2006. Victorino had a better arm and was involved in more plays (2.70 Range Factor) than Rowand (2.57). Rowand had a worse ZR in 2006 than Lofton and Michaels, and his Range Factor was worse than Michaels and not a lot better than Lofton. I was asked in an interview with the Philly Metro paper why I thought the Phillies were playing better and I credited improved pitching and Ryan Howard. That is just part of the story: Rowand’s absence was a major factor in the Phillies success. This guy killed the Phillies in 2006. He might have a great blue-collar attitude and 2006 might have been a massive fluke, but the fact remains that Rowand was awful this season. Take a quick gander at where he fell in Zone Rating for 2006:
NL Center Fielders:
1. Pierre (CHI): .911
2. Byrnes (ARZ): .899
3. Beltran (NYM): .897
4. Cameron (SD): .894
5. Taveras (HOU): .886
6. Finley (SF): .882
7. Sullivan (COL): .865
8. Lofton (LA): .861
9. Clark (MILW): .859
10. Victorino (PHI): .858
11. Rowand (PHI): .857
12. Jones (ATL): .846
That’s pretty terrible. Gold Glove winner Beltran – his principal foe for the title of b est center fielder in the N.L., I think – rated better in terms of Range Factor (2.81 for Beltran) and threw out more base runners: 10.98 per 1,000 Innings to Rowand’s 6.65. Damningly Kenny Lofton, part of the platoon Rowand replaced, did better than he did with the Dodgers … and Kenny Lofton turned 39 last season!
I can’t say for certain, but it certainly appears to me that Rowand turned out to be a massive, massive downgrade for the Phillies defense this season. Moving on...
We’ll start the Phillies infield by directing our attention to Third Base. For a long time I was fascinated by something that I discovered: David Bell might be a weak hitter and an bag of wet cement on the Phillies offense, but he is a darn good fielder. Darn good. He might even be the best defensive third baseman in baseball. The Fielding Bible rated David Bell as baseball’s best third baseman in 2005, giving him a +24 Plus / Minus rating. Bell ranked third in 2004 at +22. I always puzzle over this issue: did David Bell’s awful, awful hitting over-shadow his stellar fielding? Or was his glove-work so terrific and so valuable to the Phillies that his defense over-rode his offensive foibles and made him an asset to the Phillies? I think I finally answered the question by saying no: Bell’s offense and propensity for grounding into double plays (he grounded into 18 this season, which ranked his seventh in the N.L., and 24 last season, which was the second-most in the N.L.) made him a huge negative asset.
But once more, David Bell’s work with his glove mitigates his terrible offensive production:
Zone Rating / Range Factor / Assists per 1,000 Innings:
David Bell: .770 / 2.78 / 238.1
Abraham Nunez: .793 / 2.66 / 238.9
Let’s compare Bell to the rest of the N.L.:
3b ZR:
1. Moran Ensberg (HOU): .821
2. Pedro Feliz (SF): .817
3. Scott Rolen (STL): .803
4. Ryan Zimmerman (WAS): .786
5. David Bell (PHI/MILW): .784
6. Chad Tracy (ARI): .783
7. Aramis Ramirez (CHC): .772
8. Garrett Atkins (COL): .770
9. David Wright (NYM) .754
10. Miguel Cabrera (FLA): .748
11. Ed Encarnacion (CIN): .741
Obviously, if you take Bell’s Phillies-only numbers, Bell rates much worse, but I wanted to give a complete picture of Bell’s performance in 2006. Interestingly, David Bell ranked ninth of eleven third basemen in putouts, but ranked third in assists, which tells me that his arm is very, very good and that his reflexes are stellar. This squares with The Fielding Bible’s assessment that Bell “has a quick release and good accuracy with his throws.” It also suggests to me that maybe Bell’s range might not be so good any more.
So did the Phillies downgrade themselves when they dealt Bell to the Brewers? Probably: I am not a fan of Abraham Nunez. While one blogger argued that Nunez was an upgrade because he didn’t ground into as many double plays as Bell thanks to his speed (and this is mostly true, by the way: Nunez grounded into 7 double plays in 369 plate appearances, while Bell grounded into 11 double plays as a Phillie in 365 plate appearances), Nunez is the very definition of the light-hitting utility infielder. He’s a terrible hitter. David Bell might ground into a fair amount of 6-4-3 double plays, but at least he hit the ball with some power. Nunez slugging percentage was .273 and his isolated power number was .063. It doesn’t get much worse than that. Bell had 45 Runs Created to his credit as a Phillie to Nunez 27. Bell’s Runs Created per 27 Outs was 4.8 to Nunez 2.9. There isn’t much debate over this fact: David Bell was a much better offensive presence than Abraham Nunez, who could never advance runners like Bell does.
But Nunez the fielder held his own, with a better Zone Rating than Bell. Slightly more assists then you adjust for innings played than Bell. Six fewer errors than Bell: 8 to 14. The only area where Bell looks to be much better than Nunez is on turning double plays: Bell turned 23 and Nunez 10, which works out to be 29.44 per 1,000 innings for Bell and 15.82 for Nunez. Bell’s quickness and good footwork looks to be the decisive factor here.
In the end, I think that you can say that Bell suffered a slight drop-off over the last three seasons:
Zone Rating / Range Factor
2006: .770 / 2.78
2005: .799 / 2.84
2004: .775 / 2.88
What will 2007 bring for David Bell? Probably slight declines, although defense appears to be a constant for Bell. His hitting numbers might track up or down, but he consistently remains a top-notch fielder. As for Nunez, I can’t imagine he will be the Phillies third baseman in 2007. The sight of Nunez lightly grounding out 6-3 every other inning might be too much for Phillies fans to take. The Phillies will probably look to the free agent market. The Cubs Aramis Ramirez looks attractive (38 home runs, 119 RBIs, .299 GPA), though his price tag will be high and the Phillies need to understand that defense is secondary for Ramirez. I doubt Ramirez will go the Phillies, but this team needs someone new in 2007.
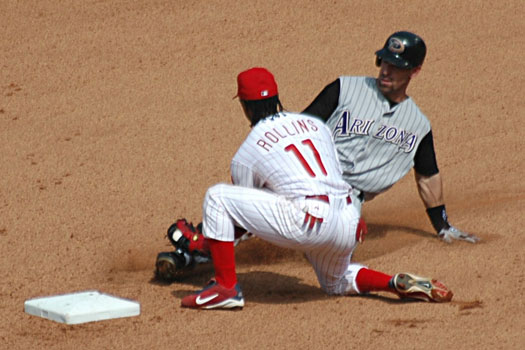
Moving across the infield, Jimmy Rollins continues to anchor the Phillies at Shortstop. The last two seasons Rollins has started 156 games. He’s tough, he’s durable and he’s a good shortstop. Not the best in the N.L. mind you, but Jimmy Rollins has quietly been turning in a solid performance for some time now. This past season J.Roll ranked 11 th of 15 NL shortstops in Zone Rating, ninth in range factor, and fifth in fielding percentage. I’m not quite sure what to make of J.Roll’s defensive skills. I tend to think he’s a good defensive shortstop, but I am very unwilling to say that he’s one of the best, because the numbers for 2006 aren’t there. The Fielding Bible called J.Roll “an outstanding fielder”, so I’ll be curious to see what The Fielding Bible 2007 has to say about J.Roll because they ranked him fourth in the majors in Plus / Minus in 2005 at +23 (three behind Rafael Furcal, eight behind Jack Wilson and ten behind Adam Everett), despite having average Zone Rating numbers for ’05. Will J.Roll rank surprisingly high? Maybe. One point in J.Roll’s favor: he made just 11 errors in 2006, after handling the ball 670 times. Adam Everett and Omar Viquel both did better than J.Roll, but pretty much nobody else did.
J.Roll’s pivot-mate, Chase U tley, is another player whom I am insanely curious to see how he’ll rank. Chase, the Phillies Second Baseman, might be the sole Phillies player qualified to win a gold glove, and he is almost certainly the only Phillie who improved his performance from 2005 on the field. In 2006 Chase Utley led the National League in put-outs with 357, 13 more than the Pirates Jose Castillo; he finished second in assists with 425; and he finished third in the National League in Range Factor at 5.15, just under the D-backs Orlando Hudson (who won the award) (5.48) and the Rockies Jamey Carroll (5.87). Most impressively Chase finished third in Zone Rating at .823.
Zone Rating:
1. Jamey Carroll (Rockies): .861
2. Craig Biggio (Astros): .833
3. Chase Utley (Phillies): .823
4. Brandon Phillips (Reds): .822
5. Josh Barfield (Padres): .819
6. Ray Durham (Giants): .808
7. Orlando Hudson (D-backs): .804
8. Dan Uggla (Marlins): .803
9. Marcus Giles (Braves): .786
10. Jose Castillo (Pirates): .760
What further impresses me is that Chase played virtually all of the Phillies defensive innings at second base. Chase logged 1,367 & 1/3 innings to Biggio’s 1,062 and Carroll’s 895 & 2/3. In fact, Chase led all National League second basemen in innings played. He was tough, durable and turned in a great perform ance all the while being the Phillies anchor at one of the most difficult positions in the game. In fact, nobody even comes close to matching Chase’s combination of defensive ability and his offensive production. He is easily the best second baseman in the National League, although the voters saw fit to give the Gold Glove to the D-backs Hudson.
The Fielding Bible expressed faint skepticism that Chase would match in ’05 performance, when his plus / minus rating was +26, second-best in baseball. I think he will, and I think he’ll improve mightily in an area where he was very deficient at in ’05: executing the double-play. In 2005 Chase ranked 34 of 36 second basemen in turning the double play (.444). Chase helped to turn 115 double plays in 2006, one less than the D-backs Hudson. Check out the evolution of Chase’s defensive skills:
Zone Rating / Range Factor / Fielding Percentage
2006: .823 / 5.15 / .978
2005: .874 / 5.06 / .978
2004: .864 / 4.89 / .982
I don’t think the drop in Zone Rating will translate to a major drop in Plus / Minus for Chase. I am very impressed by the improvement in Range Factor from season-to-season. Here is what really caught my eye:
Double Plays Turned per 1,000 Innings:
2006: 84.11
2005: 60.23
2004: 70.67
On to First Base … Ryan Howard had a great season, didn’t he? He was the big offensive force in the National League, slugging the ball like nobody else, not even Albert Pujols, could. He’s my choice for MVP for both the Phillies and the National League in 2006. He is a future fixture at first base in the All-Star game for the N.L., and he will soon be as significant a sports figure in Philadelphia as Donovan McNabb.
Okay, the only problem is that Ryan Howard had a terrible season defensively for the Phillies. Really terrible. Here is what The Fielding Bible had to say about Ryan last season: “[Howard’s] agility and footwork are surprising for a man his size…” The Fielding Bible rated Howard the second-best in Plus / Minus for 2005 at +16, just one play behind the Major League leader, Mark Teixeria, at +17, despite playing nearly half the innings Teixeria did with 706 to Teixeria’s 1,358. I doubt Ryan will rate so highly again in 2006. Howard ranked eleventh of thirteen in Zone Rating. He had the second-worst Fielding Percentage of all N.L. 1B’s, and he committed the second-highest number of errors: 14, compared to the Nationals Nick Johnson with 15.
Will Ryan rate as well as he did in 2005? I doubt it, although if you go by Zone Rating, he might:
Zone Rating / Range Factor / Errors
2006: .832 / .991 / 14
2005: .824 / .993 / 5
Ryan played 1,412 innings in 2006, or 97% of the Phillies defensive innings at first base. Nobody logged as many innings in the field in 2006. Ryan is tough and durable. I doubt he is that good of a defensive first baseman, but in any case that hardly matters: first base is a comparatively easy position to play (easiest of the four infield positions, and easier than playing center field), and Ryan’s tremendous play at the plate – .356 GPA, .346 ISO, 161 Runs Created, 149 RBI, 58 Home Runs, 84 Extra-base hits (XBH) – more than makes up for any shortcomings he might have.
Catching … if fielding is the final frontier of baseball stats and analysis, then catching is … the black hole, or a red star, or something. The Fielding Bible, much to my surprise, failed to address the matter in its 2006 edition without comment. There are a lot of variables at work here – the ERA of the pitcher when the catcher is behind the plate, how often the catcher throws out base-stealers, how often base-stealers actually bother to run, passed balls, etc. – I cannot pretend that this is an easy thing to break down and analyze. The catcher, more than any other player, has a symbiotic relationship with another player at all times: the pitcher. In how many movies is the catcher the pitcher’s confidant, mentor and psychologist all rolled into one? Think: Kevin Costner as Crash Davis in Bull Durham, Tom Berenger as Jake Taylor in Major League, and John C.Reilly as Gus Sinski in For Love of the Game. Being a catcher is the most blue-collar job in the game: squatting in the dirt, wearing lots of protective gear, etc. In each movie Costner, Berenger and Reilly are the grizzled veterans on the team.
Adding to our confusion here is the fact that the Phillies played four different catchers in 2006: starter Mike Lieberthal was missing for most of the year and logged just 484 innings of work, while Chris Coste caught another 434 & 1/3 innings, Sal Fasano caught 366 & 2/3 before being dealt to the Yankees, and Carlos Ruiz caught 176 & 1/3 innings in limited duty. In 2005 Lieberthal had been healthy for most of the year and, thus, the Phillies used his very steady and capable backup, Todd Pratt, in limited situations.
I’ll try and break things down as best I can. Let’s start with Fielding Win Shares per 1,000 Innings to try and get an overall picture:
FWS 1,000:
Fasano: 8.45
Lieberthal: 4.96
Ruiz: 4.54
Coste: 3.45
The rest of the numbers are a little more complex. Take Catchers Earned Run Average (CERA):
Fasano: 4.80
Lieberthal: 4.74
Ruiz: 4.13
Coste: 4.48
This isn’t the fairest way to look at a pitchers contribution. After all Sal Fasano became Jon Lieber’s personal catcher for part of the season, so why penalize Fasano for Lieber’s mistakes, while rewarding Ruiz for being lucky enough to catch Cole Hamels? So it isn’t a perfect metric of a catcher’s contribution to defense, however, the Phillies pitchers played much better later in the year, when Ruiz and Coste, the Phillies with the lowest CERAs, largely took over the catching duties when Fasano went to the Yankees. I think it has to be a factor. The Phillies pitched better with Ruiz and Coste, two big surprises for the Phillies and players I dearly hope will be key to the Phillies plans in 2007 (see, Part III of this series).
One of the catchers biggest duties is keeping runners from stealing bases. This is a tricky thing to figure out: if a catcher throws a lot of guys out is that because teams like to test his arm? If teams run a lot on a player is that because they like to test that catcher or are they teams that like to play hit-and-run and steal bases? If teams don’t run on a player is that because they play an OBP-oriented / Moneyball style of baseball? As a base-line, here is how often teams ran on a player and how successful they were:
Attempted Steals per 1,000 Innings / Steals Allowed
Fasano: 100.91 / 78%
Lieberthal: 97.11 / 62%
Ruiz: 79.40 / 79%
Coste: 71.37 / 81%
See the problem? Statistically teams were more likely to run on the Phillies two better arms: Fasano and Lieberthal. Ruiz and Coste allowed 80% of base-stealers to succeed, but teams were much less likely to run on them. Overall, the Phillies threw out 27% of the attempts to run on them, which was eighth-best in the National League.
I do tend to think there is a cause-and-effect relationship in terms of base-stealing: i.e., teams don’t run on teams that have guys who successfully throw out base-stealers. Of the top half of the National League when it comes to throwing base-stealers out – including the Phillies – of those eight teams, just one allowed more than 100 stolen bases, the Pirates with 102. Of the bottom eight teams, six allowed more than 100 stolen bases, including the San Diego Padres with 150 steals allowed in 176 attempts – an 85% success rate – the team that had the greatest number of attempts and the worst success in throwing base-stealers out. That conclusion is at a variance with what we saw with the Phillies.
So what was the overall effect the Phillies defense had on the team? Negative, I think. For the first time in seasons Phillies pitchers actually out-pitched their “real” ERA (i.e., their Fielding Independent ERA was better than their actual ERA), which was the first time that the Phillies superb fielders didn’t disguise the fact that the Phillies have a weak pitching staff with good play. Now, what effect did the Phillies pitchers have on this? Well, in all fairness, I should note that they do have a limited impact: as my friend Tom has noted, pitchers who surrender a lot of line-drives do make life harder on their fielders because approximately 75% of line-drives fall in for hits. Generally speaking I don’t think a decline in the quality of the Phillies pitching is an issue here for two reasons: 1) I actually think the Phillies staff was better in 2006 than 2005, and thus gave up fewer line-drives than in seasons past; and 2) even with Phillies pitchers allowing line-drives left and right the Phillies fielders still got to the ball and turned balls put into play into outs in seasons past. So why was 2006 different?
I am not sure. Maybe some of the Phillies got sloppy on defense? Maybe some of the Phillies are getting lazy and are forgetting their fundamentals? As much as I like Charlie Manuel, maybe Larry Bowa kept the fielders ready to play better with his demanding, task-master style of managing. I chalk up the Phillies problems to a decline in fundamentals (or simple bad luck, if you assume that defense is a constant) and the disastrous addition of Aaron Rowand to the Phillies defensive alignment. Rowand made a bad outfield far worse than it had been.
We’ll see what 2007 holds, but I hope that the Phillies rethink a few things. They need to get better on defense next year.
Part XII of the Wiz Kids will run on Wednesday, November 8th. Tomorrow I have some elections predictions / thoughts.
Whenever I see something on television about the latest advances in the field of science I always find myself thinking that I wish I had the ability to think and see that abstractly into a problem and come up with such an innovative understanding of what was involved. I find myself thinking about that a lot these days as I read about the advances in sabremetrics. I would never have thought of that, is what I think as I read about a new way to look at runs created or a new way to evaluate pitchers. These days there are too many ways of looking at old issues. I’ll try to cover as many as I can, but there is simply too much information floating around out there to make use of it all.
Let me start by noting that I said that 2006 was going to be the Year of the Glove for the Phillies because their defensive alignment was going to be vital to their post-season chances. The Phillies had one of the best, if not the best, defense in baseball. They finished second in the National League in Defense Efficiency Ratio (DER)*, just a little behind the Houston Astros, meaning that they were the second-best team in the N.L. in converting balls put into play into outs. As a team they also finished first in the major leagues in Plus / Minus, the system developed by The Fielding Bible’s John Dewan, a
 t +108, thirty-nine plays better than the second-place Cleveland Indians. I looked at the Phillies and felt that they would be even stronger in 2006: after all, their sole weakness was their outfield, which rated a meager +1 while the Phillies corner infield and middle infield rated +57 and +50. The addition of Aaron Rowand, the former White Sox who led the MLB in Plus / Minus for all center fielders at +30, would be a big improvement over the Jason Michaels / Kenny Lofton platoon, which managed a combined +5 in 2005.
* DER – Defense Efficiency Ratio: (Batters Faced – (Hits + Walks + Hit By Pitch + Strikeouts)) / (Batters Faced – (Home Runs, Walks + Hit By Pitch + Strikeouts)) How often fielders convert balls put into play into outs.
I was certain that the Phillies improved defense would be a major factor in their march to the post-season: consistently over the last several years the Phillies fielders have ranked at the top or near the top in DER and Plus / Minus (the Phillies ranked eighth and tenth in 2004 and 2003), a factor which helps the Phillies pitchers from having a worse ERA than they deserve. By covering up for the Phillies so-so pitching, the Phillies improved fielding will help save more runs and propel the Phillies into the playoff hunt behind their fearsome offense.
I was pretty wrong. First, let me note that we don’t have any Plus / Minus data to look at yet. I presume the updated Fielding Bible will be issued in February, but until then we have to use other stats to look at how the Phillies did in 2006.
As a team, I think we can safely say that the Phillies were much worse in 2006 then they were in seasons past. Consider team Defense Efficiency Ratio (DER):
DER:
1. San Diego: .710
2. New York: .701
3. Houston: .701
4. San Francisco: .700
5. Chicago: .698
6. St. Louis: .697
7. Washington: .689
8. Milwaukee: .685
9. Atlanta: .686
10. Arizona: .685
11. Florida: .683
12. Colorado: .683
13. Los Angeles: .681
14. Philadelphia: .681
15. Cincinnati: .680
16. Pittsburgh: .674
That’s pretty bad, but consider what a decline it represented from 2005, when the Phillies converted .703 balls put into play into outs, good for second-best in the National League. Here are how the Phillies have done in terms of DER for the last six seasons:
2006: .681 / 15th
2005: .703 / 2nd
2004: .702 / 3rd
2003: .701 / 4th
2002: .705 / 4th
2001: .699 / 4th
Wow. Curious to see when was the last time that the Phillies had played this badly on defense, I started exploring from 2000 backwards until I found a time where they were as bad as this. The result?:
2000: .693 / 6th
1999: .695 / 5th
1998: .689 / 8th
1997: .680 / 11th*
* There were fourteen teams that season. The next season the Brewers switched from the American League to the National League and the Arizona Diamondbacks came into being.
I was more than a little startled to see that. The Phillies haven’t been this bad on defense since 1997, ten campaigns ago, when the Phillies outfield consisted of Darren Daulton’s gimpy knees in right field, Gregg Jeffries played in left, and the Phillies center fielders were those noted major leaguers Ricky Otero, Midre Cummings, and Wendell Magee. That was how far the 2006 Phillies had fallen on defense.
We’ll talk about the Outfield first … In 2005 the Phillies had a pretty static situation in their outfield. Pat Burrell played in left, Bobby Abreu played in right and Kenny Lofton and Jason Michaels split time in center, with Michaels moving to left or right whenever a defensive substitution needed to be made. The Phillies outfield defense wasn’t great: the Phillies ranked eighteenth in outfield Plus / Minus.
Right Field: For the Phillies, Bobby Abreu posted a -13 Plus / Minus rating in 2005, making him
 the twenty-eighth-best rightfielder in baseball, and he held .492 of advancing runners, good for eleventh in the MLB. Despite his mediocrity, Abreu won the 2005 Gold Glove for Right Field, an outcome that provoked a combination of laughter and outrage from phloggers. Abreu played pretty much every game for the Phillies prior to the deal that sent him to the Yankees along with the late Cory Lidle. After Abreu’s departure, the Phillies played Jeff Conine, David Dellucci and Shane Victorino. Here are some of their stats:
Zone Rating / Range Factor / Assists
Bobby Abreu: .873 / 1.94 / 4
David Delluci: .872 / 1.72 / 0
Jeff Conine: .967 / 1.68 / 0
Shane Victorino: .897 / 2.37 / 3
Confused about what I’m talking about? Here are the stats I refer to defined:
Zone Rating (ZR): Is a stat which measures a player’s defensive ability by measuring plays they should have made. Admittedly, this is a stat left open to subjective opinions, but absent Plus / Minus, this is my all-around defensive stat.
Fielding Percentage (FP): (Putouts + Assists) / (Putouts + Assists + Errors). How often the player successfully handled the ball.
Range Factor (RF): (Putouts + Assists) * 9 / IP. Essentially measures how much a player is involved in defensive plays.
To play right field, you’ve got to have a good arm because you need to get the ball from right to the left side of the field to gun down runners advancing to second or third, or home plate. Whatever his mental lapses in fielding the ball, Abreu always had a decent arm. In Shane Victorino, however, I think the Phillies found a player who excels in this area. Check out Assists per 1,000 Innings:
Shane Victorino: 19.23
Bobby Abreu: 4.73
David Delluci: 0
Jeff Conine: 0
We’ll come back to this when we discuss Victorino’s performanc
 e in left and center, but we can say that Shane’s got a cannon back there. For reasons that I’ll flesh out later, I think the Phillies would be best off handing the 2007 RF job to Shane. He played well and made a lot of solid contributions in right.
Overall, Bobby Abreu played his usual so-so baseball in right in 2006. Had he and Dellucci, qualified with enough innings played, they would have ranked sixth and seventh in NL rightfielders in Zone Rating (out of eleven). Conine would have ranked first, and Victorino would have ranked third in ZR.
Let’s move on … Pat Burrell plays Left Field for the Phillies and I’m just not sure what to make of his performance in 2006. I have no idea how many times he was removed from a game for a defensive substitution, but by my count he played 988 innings in 2006 and started every game he played, which means he logged 7.84 innings a start, i.e., he didn’t play anywhere near the maximum number of innings he could have. In comparison, Bobby Abreu played 846 innings in 95 starts, or 8.90 innings a start. Even though Burrell suffered no major injury during the season, David Dellucci started 31 games in left and Victorino started three. Clearly, the Phillies saw Pat Burrell as some sort of defensive albatross around their necks and treated him as such. Burrell has, to date, actually been a decent defensive outfielder:
Plus / Minus (rank) / Baserunners Held (rank)
2003: +11 (3rd) / .364 (6th)
2004: -2 (19th) / .286 (4th)
2005: +3 (10th) / .354 (13th)
The Fielding Bible describes Burrell as having “a good arm and a quick release”, but that he lacks “great speed or range”. (Page 178.) I think he’s a solid fielder, but I am curious to see if The Fielding Bible for 2007 rates Burrell as having a major defensive slump in 2006. Here were the stats of Burrell and his chief replacements, David Dellucci and Shane Victorino:
Zone Rating / Range Factor / Assists
Pat Burrell: .857 / 1.93 / 8
David Delluci: .897 / 1.93 / 1
Shane Victorino: .846 / 2.14 / 2
Once more, the skill Victorino shows in throwing runners out manifests itself:
Assists per 1,000 Innings:
Shane Victorino: 19.80
Pat Burrell: 8.09
David Delluci: 3.56
To be sure, Zone Rating doesn’t have anything nice to say about Burrell’s skills. He’s a weaker left fielder playing a position where you stick your weakest fielder:
Zone Rating:
1. Roberts (SD): .927
2. Murton: (CHI): .889
3. Soriano (WASH): .876
4. Ethier (LA): .872
5. Holliday (COL): .870
6. Gonzalez (ARI): .867
7. Bonds (SF): .860
8. Burrell (PHI): .857
9. Bay (PIT): .839
10. Dunn (CIN): .815
11. Willingham (FLA): .790
For completeness I’ll note the year-by-year results for Pat:
Zone Rating / Assists / Assists per 1,000 Innings
2006: .857 / 8 / 8.09
2005: .882 / 10 / 7.71
2004: .872 / 9 / 8.49
I suspect that when everything is all said and done that Pat’s throwing arm will rate high for keeping runners held to their bases, but that Pat is probably on the negative side of the ledger in Plus / Minus. Moving on …
The big deal to bring Aaron Rowand to Philly to play Center Field was a move that I felt positive would improve the Phillies defense. Hey, if Rowand went +30 in ’05 and Lofton & Michaels were
 a combined +5, I figured that Aaron might contribute an extra 10, 12, 15 … maybe 20 plays to the Phillies. That might be an improvement of four or five games right there.
I was definitely wrong. I am very curious to see what Rowand rates, but he spent much of the year last or near-last in Zone Rating. I suspect that he will profile badly in Plus / Minus. Perhaps even a negative number, which means that the Phillies technically downgraded an already weak part of their team – outfield defense. Let’s compare Rowand and Victorino (his replacement after his injury) to Michaels and Lofton in 2005:
Zone Rating / Range Factor / Assists per 1,000 Innings:
Rowand (2006: .857 / 2.57 / 6.65
Victorino (2006): .858 / 2.70 / 10.74
Michaels (2005): .882 / 2.79 / 9.33
Lofton (2005): .876 / 2.53 / 9.45
For the heck of it, I’ll also throw in the Phillies ’04 center field stats:
Marlon Byrd: .846 / 2.38 / 5.31
Jason Michaels: .844 / 2.67 / 3.10
Doug Glanville: .870 / 2.83 / 0.00
Ricky Ledee: .925 / 3.68 / 29.9*
* This result was based on three assists in 100 & 1/3 innings, so it might just be a very small sample size, but still, that Ledee guy was pretty good in ’04 wasn’t he?
 In nearly every aspect, Aaron Rowand was a massive disappointment to the Phillies. Offensively, which is something I’ll explore in Part III, he was a nightmare: a free-swinging easy out. Defensively, his reputation for quickness and having a terrific arm was utterly absent in 2006. Victorino had a better arm and was involved in more plays (2.70 Range Factor) than Rowand (2.57). Rowand had a worse ZR in 2006 than Lofton and Michaels, and his Range Factor was worse than Michaels and not a lot better than Lofton. I was asked in an interview with the Philly Metro paper why I thought the Phillies were playing better and I credited improved pitching and Ryan Howard. That is just part of the story: Rowand’s absence was a major factor in the Phillies success. This guy killed the Phillies in 2006. He might have a great blue-collar attitude and 2006 might have been a massive fluke, but the fact remains that Rowand was awful this season. Take a quick gander at where he fell in Zone Rating for 2006:
NL Center Fielders:
1. Pierre (CHI): .911
2. Byrnes (ARZ): .899
3. Beltran (NYM): .897
4. Cameron (SD): .894
5. Taveras (HOU): .886
6. Finley (SF): .882
7. Sullivan (COL): .865
8. Lofton (LA): .861
9. Clark (MILW): .859
10. Victorino (PHI): .858
11. Rowand (PHI): .857
12. Jones (ATL): .846
That’s pretty terrible. Gold Glove winner Beltran – his principal foe for the title of b
 est center fielder in the N.L., I think – rated better in terms of Range Factor (2.81 for Beltran) and threw out more base runners: 10.98 per 1,000 Innings to Rowand’s 6.65. Damningly Kenny Lofton, part of the platoon Rowand replaced, did better than he did with the Dodgers … and Kenny Lofton turned 39 last season!
I can’t say for certain, but it certainly appears to me that Rowand turned out to be a massive, massive downgrade for the Phillies defense this season. Moving on...
We’ll start the Phillies infield by directing our attention to Third Base. For a long time I was fascinated by something that I discovered: David Bell might be a weak hitter and an bag of wet cement on the Phillies offense, but he is a darn good fielder. Darn good. He might even be the best defensive third baseman in baseball. The Fielding Bible rated David Bell as baseball’s best third baseman in 2005, giving him a +24 Plus / Minus rating. Bell ranked third in 2004 at +22. I always puzzle over this issue: did David Bell’s awful, awful hitting over-shadow his stellar fielding? Or was his glove-work so terrific and so valuable to the Phillies that
 his defense over-rode his offensive foibles and made him an asset to the Phillies? I think I finally answered the question by saying no: Bell’s offense and propensity for grounding into double plays (he grounded into 18 this season, which ranked his seventh in the N.L., and 24 last season, which was the second-most in the N.L.) made him a huge negative asset.
But once more, David Bell’s work with his glove mitigates his terrible offensive production:
Zone Rating / Range Factor / Assists per 1,000 Innings:
David Bell: .770 / 2.78 / 238.1
Abraham Nunez: .793 / 2.66 / 238.9
Let’s compare Bell to the rest of the N.L.:
3b ZR:
1. Moran Ensberg (HOU): .821
2. Pedro Feliz (SF): .817
3. Scott Rolen (STL): .803
4. Ryan Zimmerman (WAS): .786
5. David Bell (PHI/MILW): .784
6. Chad Tracy (ARI): .783
7. Aramis Ramirez (CHC): .772
8. Garrett Atkins (COL): .770
9. David Wright (NYM) .754
10. Miguel Cabrera (FLA): .748
11. Ed Encarnacion (CIN): .741
Obviously, if you take Bell’s Phillies-only numbers, Bell rates much worse, but I wanted to give a complete picture of Bell’s performance in 2006. Interestingly, David Bell ranked ninth of eleven third basemen in putouts, but ranked third in assists, which tells me that his arm is very, very good and that his reflexes are stellar. This squares with The Fielding Bible’s assessment that Bell “has a quick release and good accuracy with his throws.” It also suggests to me that maybe Bell’s range might not be so good any more.
So did the Phillies downgrade themselves when they dealt Bell to the Brewers? Probably: I am not a fan of Abraham Nunez. While one blogger argued that Nunez was an upgrade because he didn’t ground into as many double plays as Bell thanks to his speed (and this is mostly true, by the way: Nunez grounded into 7 double plays in 369 plate appearances, while Bell grounded into 11 double plays as a Phillie in 365 plate appearances), Nunez is the very definition of the light-hitting utility infielder. He’s a terrible hitter. David Bell might ground into a fair amount of 6-4-3 double plays, but at least he hit the ball with some power. Nunez slugging percentage was .273 and his isolated power number was .063. It doesn’t get much worse than that. Bell had 45 Runs Created to his credit as a Phillie to Nunez 27. Bell’s Runs Created per 27 Outs was 4.8 to Nunez 2.9. There isn’t much debate over this fact: David Bell was a much better offensive presence than Abraham Nunez, who could never advance runners like Bell does.
But Nunez the fielder held his own, with a better Zone Rating than Bell. Slightly more assists then you adjust for innings played than Bell. Six fewer errors than Bell: 8 to 14. The only area where Bell looks to be much better than Nunez is on turning double plays: Bell turned 23 and Nunez 10, which works out to be 29.44 per 1,000 innings for Bell and 15.82 for Nunez. Bell’s quickness and good footwork looks to be the decisive factor here.
In the end, I think that you can say that Bell suffered a slight drop-off over the last three seasons:
Zone Rating / Range Factor
2006: .770 / 2.78
2005: .799 / 2.84
2004: .775 / 2.88
What will 2007 bring for David Bell? Probably slight declines, although defense appears to be a constant for Bell. His hitting numbers might track up or down, but he consistently remains a top-notch fielder. As for Nunez, I can’t imagine he will be the Phillies third baseman in 2007. The sight of Nunez lightly grounding out 6-3 every other inning might be too much for Phillies fans to take. The Phillies will probably look to the free agent market. The Cubs Aramis Ramirez looks attractive (38 home runs, 119 RBIs, .299 GPA), though his price tag will be high and the Phillies need to understand that defense is secondary for Ramirez. I doubt Ramirez will go the Phillies, but this team needs someone new in 2007.
Moving across the infield, Jimmy Rollins continues to anchor the Phillies
 at Shortstop. The last two seasons Rollins has started 156 games. He’s tough, he’s durable and he’s a good shortstop. Not the best in the N.L. mind you, but Jimmy Rollins has quietly been turning in a solid performance for some time now. This past season J.Roll ranked 11 th of 15 NL shortstops in Zone Rating, ninth in range factor, and fifth in fielding percentage. I’m not quite sure what to make of J.Roll’s defensive skills. I tend to think he’s a good defensive shortstop, but I am very unwilling to say that he’s one of the best, because the numbers for 2006 aren’t there. The Fielding Bible called J.Roll “an outstanding fielder”, so I’ll be curious to see what The Fielding Bible 2007 has to say about J.Roll because they ranked him fourth in the majors in Plus / Minus in 2005 at +23 (three behind Rafael Furcal, eight behind Jack Wilson and ten behind Adam Everett), despite having average Zone Rating numbers for ’05. Will J.Roll rank surprisingly high? Maybe. One point in J.Roll’s favor: he made just 11 errors in 2006, after handling the ball 670 times. Adam Everett and Omar Viquel both did better than J.Roll, but pretty much nobody else did.
J.Roll’s pivot-mate, Chase U
 tley, is another player whom I am insanely curious to see how he’ll rank. Chase, the Phillies Second Baseman, might be the sole Phillies player qualified to win a gold glove, and he is almost certainly the only Phillie who improved his performance from 2005 on the field. In 2006 Chase Utley led the National League in put-outs with 357, 13 more than the Pirates Jose Castillo; he finished second in assists with 425; and he finished third in the National League in Range Factor at 5.15, just under the D-backs Orlando Hudson (who won the award) (5.48) and the Rockies Jamey Carroll (5.87). Most impressively Chase finished third in Zone Rating at .823.
Zone Rating:
1. Jamey Carroll (Rockies): .861
2. Craig Biggio (Astros): .833
3. Chase Utley (Phillies): .823
4. Brandon Phillips (Reds): .822
5. Josh Barfield (Padres): .819
6. Ray Durham (Giants): .808
7. Orlando Hudson (D-backs): .804
8. Dan Uggla (Marlins): .803
9. Marcus Giles (Braves): .786
10. Jose Castillo (Pirates): .760
What further impresses me is that Chase played virtually all of the Phillies defensive innings at second base. Chase logged 1,367 & 1/3 innings to Biggio’s 1,062 and Carroll’s 895 & 2/3. In fact, Chase led all National League second basemen in innings played. He was tough, durable and turned in a great perform
 ance all the while being the Phillies anchor at one of the most difficult positions in the game. In fact, nobody even comes close to matching Chase’s combination of defensive ability and his offensive production. He is easily the best second baseman in the National League, although the voters saw fit to give the Gold Glove to the D-backs Hudson.
The Fielding Bible expressed faint skepticism that Chase would match in ’05 performance, when his plus / minus rating was +26, second-best in baseball. I think he will, and I think he’ll improve mightily in an area where he was very deficient at in ’05: executing the double-play. In 2005 Chase ranked 34 of 36 second basemen in turning the double play (.444). Chase helped to turn 115 double plays in 2006, one less than the D-backs Hudson. Check out the evolution of Chase’s defensive skills:
Zone Rating / Range Factor / Fielding Percentage
2006: .823 / 5.15 / .978
2005: .874 / 5.06 / .978
2004: .864 / 4.89 / .982
I don’t think the drop in Zone Rating will translate to a major drop in Plus / Minus for Chase. I am very impressed by the improvement in Range Factor from season-to-season. Here is what really caught my eye:
Double Plays Turned per 1,000 Innings:
2006: 84.11
2005: 60.23
2004: 70.67
On to First Base … Ryan Howard had a great season, didn’t he? He was the big offensive force in the National League, slugging the ball like nobody else, not even Albert Pujols, could. He’s my choice for MVP for both the Phillies and the National League in 2006. He is a future fixture at first base in the All-Star game for the N.L., and he will soon be as significant a sports figure in Philadelphia as Donovan McNabb.
Okay, the only problem is that Ryan Howard had a terrible season defensively for the Phillies. Really terrible. Here is what The Fielding Bible had to say about Ryan last season: “[Howard’s] agility and footwork are surprising for a man his size…” The Fielding Bible rated Howard the second-best in Plus / Minus for 2005 at +16, just one play behind the Major League leader, Mark Teixeria, at +17, despite playing nearly half the innings Teixeria did with 706 to Teixeria’s 1,358. I doubt Ryan will rate so highly again in 2006. Howard ranked eleventh of thirteen in Zone Rating. He had the second-worst Fielding Percentage of all N.L. 1B’s, and he committed the second-highest number of errors: 14, compared to the Nationals Nick Johnson with 15.
Will Ryan rate as well as he did in 2005? I doubt it, although if you go by Zone Rating, he might:
Zone Rating / Range Factor / Errors
2006: .832 / .991 / 14
2005: .824 / .993 / 5
Ryan played 1,412 innings in 2006, or 97% of the Phillies defensive innings at first base. Nobody logged as many innings in the field in 2006. Ryan is tough and durable. I doubt he is that good of a defensive first baseman, but in any case that hardly matters: first base is a comparatively easy position to play (easiest of the four infield positions, and easier than playing center field), and Ryan’s tremendous play at the plate – .356 GPA, .346 ISO, 161 Runs Created, 149 RBI, 58 Home Runs, 84 Extra-base hits (XBH) – more than makes up for any shortcomings he might have.
Catching … if fielding is the final frontier of baseball stats and analysis, then catching is … the black hole, or a red star, or something. The Fielding Bible, much to my surprise, failed to address the matter in its 2006 edition without comment. There are a lot of variables at work here – the ERA of the pitcher when the catcher is behind the plate, how often the catcher throws out base-stealers, how often base-stealers actually bother to run, passed balls, etc. – I cannot pretend that this is an easy thing to break down and analyze. The catcher, more than any other player, has a symbiotic relationship with another player at all times: the pitcher. In how many movies is the catcher the pitcher’s confidant, mentor and psychologist all rolled into one? Think: Kevin Costner as Crash Davis in Bull Durham, Tom Berenger as Jake Taylor in Major League, and John C.Reilly as Gus Sinski in For Love of the Game. Being a catcher is the most blue-collar job in the game: squatting in the dirt, wearing lots of protective gear, etc. In each movie Costner, Berenger and Reilly are the grizzled veterans on the team.
Adding to our confusion here is the fact that the Phillies played four different catchers in 2006: starter Mike Lieberthal was missing for most of the year and logged just 484 innings of work, while Chris Coste caught another 434 & 1/3 innings, Sal Fasano caught 366 & 2/3 before being dealt to the Yankees, and Carlos Ruiz caught 176 & 1/3 innings in limited duty. In 2005 Lieberthal had been healthy for most of the year and, thus, the Phillies used his very steady and capable backup, Todd Pratt, in limited situations.
I’ll try and break things down as best I can. Let’s start with Fielding Win Shares per 1,000 Innings to try and get an overall picture:
FWS 1,000:
Fasano: 8.45
Lieberthal: 4.96
Ruiz: 4.54
Coste: 3.45
The rest of the numbers are a little more complex. Take Catchers Earned Run Average (CERA):
Fasano: 4.80
Lieberthal: 4.74
Ruiz: 4.13
Coste: 4.48
This isn’t the fairest way to look at a pitchers contribution. After all Sal Fasano became Jon Lieber’s personal catcher for part of the season, so why penalize Fasano for Lieber’s mistakes, while rewarding Ruiz for being lucky enough to catch Cole Hamels? So it isn’t a perfect metric of a catcher’s contribution to defense, however, the Phillies pitchers played much better later in the year, when Ruiz and Coste, the Phillies with the lowest CERAs, largely took over the catching duties when Fasano went to the Yankees. I think it has to be a factor. The Phillies pitched better with Ruiz and Coste, two big surprises for the Phillies and players I dearly hope will be key to the Phillies plans in 2007 (see, Part III of this series).
One of the catchers biggest duties is keeping runners from stealing bases. This is a tricky thing to figure out: if a catcher throws a lot of guys out is that because teams like to test his arm? If teams run a lot on a player is that because they like to test that catcher or are they teams that like to play hit-and-run and steal bases? If teams don’t run on a player is that because they play an OBP-oriented / Moneyball style of baseball? As a base-line, here is how often teams ran on a player and how successful they were:
Attempted Steals per 1,000 Innings / Steals Allowed
Fasano: 100.91 / 78%
Lieberthal: 97.11 / 62%
Ruiz: 79.40 / 79%
Coste: 71.37 / 81%
See the problem? Statistically teams were more likely to run on the Phillies two better arms: Fasano and Lieberthal. Ruiz and Coste allowed 80% of base-stealers to succeed, but teams were much less likely to run on them. Overall, the Phillies threw out 27% of the attempts to run on them, which was eighth-best in the National League.
I do tend to think there is a cause-and-effect relationship in terms of base-stealing: i.e., teams don’t run on teams that have guys who successfully throw out base-stealers. Of the top half of the National League when it comes to throwing base-stealers out – including the Phillies – of those eight teams, just one allowed more than 100 stolen bases, the Pirates with 102. Of the bottom eight teams, six allowed more than 100 stolen bases, including the San Diego Padres with 150 steals allowed in 176 attempts – an 85% success rate – the team that had the greatest number of attempts and the worst success in throwing base-stealers out. That conclusion is at a variance with what we saw with the Phillies.
So what was the overall effect the Phillies defense had on the team? Negative, I think. For the first time in seasons Phillies pitchers actually out-pitched their “real” ERA (i.e., their Fielding Independent ERA was better than their actual ERA), which was the first time that the Phillies superb fielders didn’t disguise the fact that the Phillies have a weak pitching staff with good play. Now, what effect did the Phillies pitchers have on this? Well, in all fairness, I should note that they do have a limited impact: as my friend Tom has noted, pitchers who surrender a lot of line-drives do make life harder on their fielders because approximately 75% of line-drives fall in for hits. Generally speaking I don’t think a decline in the quality of the Phillies pitching is an issue here for two reasons: 1) I actually think the Phillies staff was better in 2006 than 2005, and thus gave up fewer line-drives than in seasons past; and 2) even with Phillies pitchers allowing line-drives left and right the Phillies fielders still got to the ball and turned balls put into play into outs in seasons past. So why was 2006 different?
I am not sure. Maybe some of the Phillies got sloppy on defense? Maybe some of the Phillies are getting lazy and are forgetting their fundamentals? As much as I like Charlie Manuel, maybe Larry Bowa kept the fielders ready to play better with his demanding, task-master style of managing. I chalk up the Phillies problems to a decline in fundamentals (or simple bad luck, if you assume that defense is a constant) and the disastrous addition of Aaron Rowand to the Phillies defensive alignment. Rowand made a bad outfield far worse than it had been.
We’ll see what 2007 holds, but I hope that the Phillies rethink a few things. They need to get better on defense next year.
Part XII of the Wiz Kids will run on Wednesday, November 8th. Tomorrow I have some elections predictions / thoughts.
Comments:
Post a Comment
![]()


