Monday, November 13, 2006
The Wiz Kids, Part XIII: How The NL Was Won
So how did the Phillies win the National League Pennant in 1950? They did it despite being an average-to-weak hitting team: the Phillies ranked fourth of eight team in terms of runs scored in 1950, averaging 4.6 runs a game, slightly under the league average for that year (4.66). The top hitting team in the NL in 1950 was the fearsome Brooklyn Dodgers, who scored 125 more runs than the Phillies:
Runs Scored:
Brooklyn: 847
Boston: 785
New York: 735
Phillies: 722
St. Louis: 693
Pittsburgh: 681
Cincinnati: 654
Chicago: 643
The Dodgers did nearly everything well. They hit with power, drew walks, etc. For example, consider Isolated Power (ISO): .SLG - .BA = .ISO. ISO simply measures a player’s raw power by subtracting singles from their slugging percentage.
Isolated Power: 1950 National League
1. Dodgers: .172
2. Cubs: .153
3. Braves: .142
4. Pirates: .142
5. Giants: .134
6. Phillies: .131
7. Cardinals: .127
8. Reds: .116
League: .140
The Dodgers weren’t simply a collection of sluggers though. They were a well-rounded offensive juaggernaut. Consider Gross Productive Average (GPA): (1.8 * .OBP + .SLG) / 4 = .GPA. Invented by The Hardball Times Aaron Gleeman, GPA measures a players production by weighing his ability to get on base and hit with power. This is my preferred all-around stat.
GPA: 1950 National League
1. Dodgers: .267
2. Braves: .254
3. Pirates: .252
4. Giants: .250
5. Cardinals: .248
6. Phillies: .248
7. Reds: .240
8. Cubs: .240
League: .250
The Phillies were below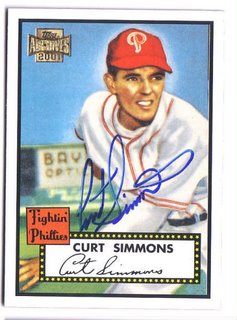 the league averages for runs scored per game (4.60 to 4.66), On-Base-Percentage (OBP) (.331 to .333), Slugging Percentage (.396 to .401), walks (535 to 567), and Home Runs (125 to 138). The Phillies were seventh in stolen bases with less than half as many as the Dodgers (77 to 33). The Dodgers hit 22 more doubles, 69 more home runs and drew 72 more walks than the Phillies. While the gap between hits was small (1461 for the Dodgers, 1440 for the Phils) and the Phils had more triples (55 vs. 46), the Dodgers were really much better at the plate. The Phillies had to scrap and fight for every run.
The Phillies did it with pitching and defense. They were an atypical 1950s baseball team because they relied on pitching and defense to compensate for a generally light-hitting offensive unit. The popular image of 1950s baseball teams as being reliant on offense, and specifically the home run, is embodied by the Dodgers and Hall of Famers like Jackie Robinson, Roy Campanella and Duke Snider. The Dodgers were a fearsome offensive force but struggled defensively. The Dodgers allowed 736 runs to the Phillies 624, a 112 run difference:
Runs Allowed:
1. Phillies: 624
2. New York: 643
3. St. Louis: 670
4. Brooklyn: 724
5. Cincinnati: 734
6. Boston: 736
7. Chicago: 772
8. Pittsburgh: 857
A big factor here was that the Phillies pitching was substantially better than the Dodgers pitching. Few would dispute the fact that the Phillies had the best pitching staff in the National League that year:
ERA
1. Phillies: 3.50
2. Giants: 3.71
3. Cardinals: 3.97
4. Braves: 4.14
5. Dodgers: 4.28
6. Cubs: 4.28
7. Reds: 4.32
8. Pirates: 4.96
League: 4.14
ERA – Earned Run Average: (Earned Runs * 9) / IP = ERA
However, ERA only tells part of the story. As baseball pundits have shown, ERA is oftentimes influenced by the defensive play of the fielders behind the pitcher. Consider Fielding Independent Pitching: FIP is simply where we eliminate defense and concentrate on how a team’s pitchers did with things they could control: strikeouts, walks, home runs. The formula is simple: (((13 * HR) + (3 * BB) – (2 * K)) / IP) + League Factor. If we strip out and neutralize defense, the Phillies still turned in a great performance:
FIP ERA:
1. Phillies: 3.89
2. Cardinals: 3.95
3. Braves: 4.04
4. Giants: 4.14
5. Reds: 4.17
6. Dodgers: 4.20
7. Cubs: 4.23
8. Pirates: 4.50
League: 4.14
Even with the tremendous fielding the Phillies got in 1950, they still pitched stunningly well. Notice that the Giants pitching falls off dramatically when you strip out defense from the equation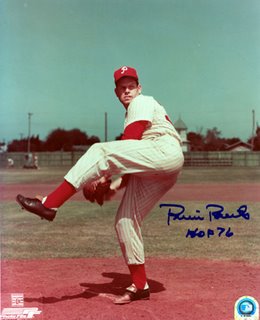 .
.
How can we tell how well the Phillies fielded in 1950? By looking at their Defense Efficiency Ratio (DER). Simply put, DER measures how well the Phillies did with the balls that were put into play by their pitchers. DER – Defense Efficiency Ratio: (Batters Faced – (Hits + Walks + Hit By Pitch + Strikeouts)) / (Batters Faced – (Home Runs, Walks + Hit By Pitch + Strikeouts)) How often fielders convert balls put into play into outs. Here how the Phillies did in terms of DER:
Defense Efficiency Ratio (DER):
1. New York: .729
2. Phillies: .719
3. Reds: .708
4. Dodgers: .703
5. Cardinals: .702
6. Pirates: .701
7. Dodgers: .701
8. Cubs: .694
The good defensive play and the good pitching allowed the Phillies to win the close games and edge the Dodgers for the pennant. The Phillies were 30-16 (.652) in one-run games, whereas the Dodgers were just 23-21 (.523). The 1950 Dodgers played in more “blow-out” games (games decided by five or more runs) than the Phillies: 46 to 28, so a lot of the runs they scored were “wasted”, scattered throughout the season where they would have benefited the Dodgers had they been scored in more games. Pitching and defense won out, despite the fact that the Dodgers run differential was far better than the Phillies:
Phillies: +98
Dodgers: +123
The Phillies had the best record in the NL in games decided by a run:
Win-Loss (Pct.)
1. Phillies: 30-16, .652
2. Giants: 26-17, .605
3. Dodgers: 23-21, .523
4. Cubs: 21-22, .488
5. Pirates: 21-22, .488
6. Braves: 18-21, .462
7. Cardinals: 23-29, .442
8. Reds: 16-30, .348
If you look at the Pythagorean Win-Loss records, the National League should have been won by the Dodgers:
1. Dodgers: 88-66
2. Phillies: 87-67
3. Giants: 86-68
4. Braves: 82-72
5. Cardinals: 79-74
6. Reds: 68-85
7. Cubs: 64-89
8. Pirates: 61-92
 The Phillies out-performed their Pythagorean Win-Loss record by four games. Not a major variance, but a significant one. Aside from the Pirates under-performing their Pythagorean record by four games, no other team had a plus or minus number greater than two. So that edge in close games was the decisive factor in the Phillies 1950 pennant. That pitching and defense was the factor that gave the Phillies the pennant over a team that was probably a little better than they were.
So who were the Phillies top performers? Let’s start with the Phillies position players …
Gross Productive Average (GPA):
Andy Seminick (C): .311
Del Ennis (RF): .305
Dick Sisler (LF): .278
Richie Ashburn (CF): .268
Willie Jones (3B): .266
Eddie Waitkus (1B): .243
Granny Hamner (SS): .236
Mike Goliat (2B): .233
Dick Whitman (OF*): .218
Stan Lopata: (C*): .216
Jimmy Bloodworth (IF*): .186
Team: .248
League: .250
* indicates these players are reserves.
The Phillies offense fell below the league average for GPA. They simply did not preserve their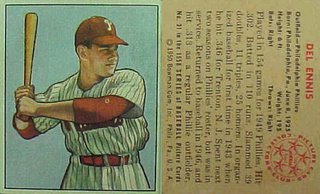 outs and move runners as effectively as teams like the Dodgers or Braves did. The Phillies scrapped for runs and largely relied on Del Ennis. Seminick played well, but as the team’s catcher he had to miss about a fifth of the team’s games because catching wears even the toughest ballplayers out. Sisler, Ashburn and Jones all moved runners well, but Ennis was the key to the Phillies offense. Aside from Seminick, he had the highest GPA on the team. He was also the team’s most powerful bat:
Isolated Power (ISO):
Del Ennis (RF): .240
Andy Seminick (C): .236
Willie Jones (3B): .189
Dick Sisler (LF): .146
Mike Goliat (2B): .132
Granny Hamner (SS): .110
Richie Ashburn (CF): .099
Eddie Waitkus (1B): .075
Stan Lopata: (C*): .070
Dick Whitman (OF*): .053
Jimmy Bloodworth (IF*): .021
Team: .131
League: .140
Again, Seminick’s contributions are tempered by the fact that he missed about 20% of the team’s games. Ennis is clearly the Phillies big threat to move the runners along. Subtract Ennis from the Phillies lineup and their slugging percentage falls to just .377, just .001 better than the Cincinnati Reds, the team with the lowest slugging percentage in the game.
Ashburn’s .099 ISO isn’t much of a surprise: he was the quintessential lead-off man, so hitting for power was the furthest thing from his mind. In fact, his 1950 ISO was pretty good: his career ISO was .074. Ashburn hit a career-high fourteen triples and had fourty-one extra base hits …
Ennis was the key to the Phillies offense. He had 73 extra-base hits (14 more than Willie Jones), 126 RBIs (38 more than Jones) and led the team in home runs with 31 (six more than Jones). Look at Runs Created and Runs Created per 27 Outs to see how vital Ennis was to the Phillies:
Runs Created / RC27
Ennis: 114 / 7.09
Jones: 94 / 5.37
Ashburn: 91 / 5.66
Sisler: 88 / 6.17
Seminick: 84 / 7.80
Waitkus: 79 / 4.48
Hamner: 74 / 4.14
Goliat: 53 / 3.66
Whitman: 12 / 3.32
Lopata: 12 / 3.17
Bloodworth: 6 / 2.30
Team: 714 / 4.60
League: 5746 / 4.71
The Phillies had three regulars who fell below the team and league averages for runs created: Waitkus, Hamner and Goliat, essentially the team’s entire infield, aside from third baseman Willie Jones. What is surprising to me is how little production the Phillies got from their first baseman: Waitkus. First is usually a position teams stick defensively challenged sluggers in, but Waitkus had the lowest Isolated Power number of any Phillie regular and contributed less to the Phillies offense than any player save the Phillies middle infielders, Granny Hamner and Mike Goliat. I should note that Waitkus has an extraordinary contact hitter, striking out just 29 times in 1950 despite having 641 At-Bats. I marveled in a previous post at how Jackie Robinson managed to strikeout just 24 times in 518 At-Bats, but I’d be remiss if I didn’t note how Waitkus was actually more difficult to strikeout: 4.5% to 4.6%.
Ennis was clearly the Phillies offensive engine, producing 16% of the Phillies total Runs Created. Had Ennis been replaced by an average player* the Phillies would have lost 38 runs from their lineup. I think that losing those thirty-eight runs would have cost the Phillies four to eight games. Given that the Phils won thirty games by a run, that might be a conservative estimate. Since the Phillies won the NL by just two games, I think we can safely say that the Phillies would not have won the NL without Del Ennis’ contributions in 1950. They probably would have fallen to third, behind the New York Giants.
* I calculated that an average player gaining 4.71 runs created per 27 outs who made 436 outs, as Del Ennis did in 1950, would have 76 Runs Created. I suspect my methodology is seriously flawed, but there you go.
What is very interesting to me when you look at the Phillies lineup is to see how ridiculously young the Phillies players were in 1950. The Phillies regulars were 26.5 years old on average. Del Ennis was just 25. Willie Jones was 24. Richie Ashburn and Granny Hamner were 23. I’ll talk about the Phillies pitching in a moment, but consider the fact that Robin Roberts was 23 and Curt Simmons was just 21. The key players on the Phillies were absurdly young. Contrast that with the Dodgers: Campanella was 28, Gil Hodges was 26, Jackie Robinson was 31, as was Pee Wee Reese. Duke Snider and Don Newcombe were the Dodgers sole youngsters at 23 and 24 respectively. All of the ’50 Dodgers played on the ’49 World Series team, so the pressure of playing for the NL pennant was nothing new even to Snider and Newcombe. For the Phillies, the stress of chasing the pennant was entirely new. That this team of rookies and newbies held together and managed to win the 1950 National League pennant is nothing short of miraculous. They truly were the Wiz Kids.
Defensively, the Phillies were pretty darn good in 1950. The key play of the year was Ashburn’s on-target throw to Lopata to gun down Cal Abrams at the plate on the final day of the season. (See, Part XII.)
It is difficult to look at a lot of the data that we have from 1950 and get a better sense of which Phillies players played better than others because stats like Zone Rating and Plus / Minus are essentially impossible to apply retroactively. We can look at the Phillies team defense and compare the team stats to the rest of the league. As I showed, supra, the Phillies were second Defense Efficiency Ratio (DER). Consider Un-Earned Run Average (UERA):
UERA:
1. Dodgers: 0.41
2. Cardinals: 0.48
3. Phillies: 0.49
4. Giants: 0.50
5. Reds: 0.55
6. Braves: 0.64
7. Pirates: 0.68
8. Cubs: 0.79
League: 0.57
This is an imperfect stat, but clearly the Phillies weren’t allowing preventable runs the way the Cubs were.
I suspect that one of the keys to the Phillies success was their tremendous outfield. Richie Ashburn led the NL in putouts in 1950 with 405, eleven more than the Giants Bobby Thomson and 27 more than the Dodgers Duke Snider. Without knowing how often Phillies pitchers allowed flyballs versus groundballs, I figured out how often Phillies outfielders made putouts and multiplied them per 1,000 innings. Here are the results:
1. Pirates: 783.63
2. Giants: 778.91
3. Phillies: 768.85
4. Braves: 766.06
5. Dodgers: 742.26
6. Reds: 741.34
7. Cardinals: 729.35
8. Cubs: 711.89
League: 752.88
I caution that this isn’t scientific at all: the Dodgers outfielders didn’t make a lot of plays in part because their pitchers led the league in strikeouts and didn’t allow many balls to be put into play! I think this gives you an idea though. The Phillies pitchers were excellent, but they did oftentimes have to rely on their fielders to convert balls put into play into outs.
If there is anyone out there with any ideas on how we can make a more scientific analysis of the Phillies defense based on existing stats, let me know.
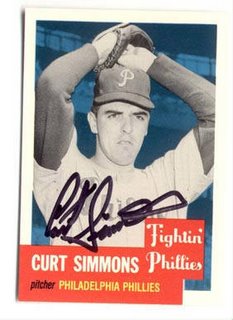
Speaking of the Phillies pitchers, they were quite excellent. Most people who remember the Wiz Kids remember Robin Roberts and remember how great he was in his career, but Curt Simmons was just as good. Consider the Fielding Independent Pitching ERAs of the Phillies main pitchers:
FIP:
Curt Simmons: 3.53
Robin Roberts: 3.55
Bob Miller: 3.66
Jim Konstanty: 3.70
Bubba Church: 4.09
Ken Heintzelman: 4.22
Russ Meyer: 4.56
Team: 3.89
League: 4.14
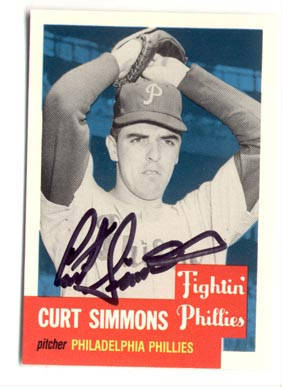
Simmons was, in some respects, a better pitcher than Roberts that season. He was tougher to get a home run off (0.79 home runs per nine innings versus 0.86 for Roberts) and struckout more batters (6.12 strikeouts per nine innings versus 4.32 for Roberts). Roberts was tougher to get a walk off (2.28 walks per nine innings compared to Simmons pedestrian 3.69), and there is an argument that Roberts probably suffered from fatigue. Simmons left for the Army in mid-season while Roberts stayed with the team and carried the load for the pitching staff. Roberts started 39 games to Simmons 27, completed 21 compared to Simmons 11, threw five shutouts to Simmons two, and faced 1,228 batters in 1950, second in the National League that season to the Braves Vern Bickford (who faced an astonishing 1,325 batters) to Simmons 896. Robin Roberts was the Phillies best pitcher and the ball for the October 1 game against the Dodgers belonged in his hand, but Roberts and Simmons made for a lethal one-two punch.
The rest of the Phillies pitching staff was also extremely good. Bob Miller, I was stunned to see, was an absurdly difficult pitcher to hit a home run off of: 0.47 per nine innings (nine home runs allowed despite facing 755 batters). Roberts surrendered 29 home runs in 1950, but he also faced 1,228 batters along the way. Despite having to play the Dodgers, Braves and Cubs, the Phillies pitchers were stingy with the home runs allowed: 0.78 per nine innings, best in the league, compared with the league average of 0.90 …
After Roberts and Simmons, the Phillies most important pitcher was Jim Konstanty. On a team nick-named the Wiz Kids for their youth, Konstanty was 33 that season and was an unlikely hero. In an age before specialized closers dominated the ends of baseball games, Konstanty was the Phillies closer, their fireman. Konstanty appeared in 74 of the Phillies 157 games (47%), making twenty-three more appearance then the Pirates Murry Dickson. Konstanty saved twenty-two games, fourteen more than the Pirates Bill Werle. Konstanty finished sixty-two of the Phillies games, thirty-nine more than the Pirates Vic Lombardi. Konstanty was the winning pitcher or the saving pitcher in thirty-eight of the Phillies ninty-one victories. Even though Konstanty’s FIP ERA was a run higher than his “real” ERA (3.70 vs. 2.66), he was a terrific pitcher whose ability to keep runners off the base paths was absolutely critical to the Phillies success. Despite being a below-average strikeout pitcher (just 3.32 per nine innings, compared to the team average of 3.96 and the league average of 4.09), he kept runners off the base paths. Konstanty’s WHIP was just 1.04, lower than Roberts (1.18) or Simmons (1.24).
And that was how the NL was won. Through tough defense, imposing pitching and timely hitting. Looking at all of the Phillies, you have to say that they had many players whose performance can be categorized as “critical”, from Del Ennis’ hitting to Roberts, Simmons and Konstanty’s pitching to Richie Ashburn’s fielding. Without those five players, the Phillies would have been dead in the water in 1950 and simply been an also-ran, a footnote, in the story of the Dodgers and Giants duopoly of the NL during the 1950s.
Instead, the Wiz Kids were on to the World Series.
Previous Installments of the Wiz Kids:
Part XII: October 1, 1950.
Part XI: Richie Ashburn.
Part X: The Phillies Farm System.
Part IX: The second half of the 1950 season.
Part VIII: The Braves, Cardinals, Pirates, Cubs & Reds.
Part VII: The Giants and Dodgers.
Part VI: Curt Simmons.
Part V: Robin Roberts.
Part IV: The first half of the 1950 season.
Part III: Jim Konstanty.
Part II: Eddie Sawyer.
Part I: The Path to 1950.
Prolouge.
Runs Scored:
Brooklyn: 847
Boston: 785
New York: 735
Phillies: 722
St. Louis: 693
Pittsburgh: 681
Cincinnati: 654
Chicago: 643
The Dodgers did nearly everything well. They hit with power, drew walks, etc. For example, consider Isolated Power (ISO): .SLG - .BA = .ISO. ISO simply measures a player’s raw power by subtracting singles from their slugging percentage.
Isolated Power: 1950 National League
1. Dodgers: .172
2. Cubs: .153
3. Braves: .142
4. Pirates: .142
5. Giants: .134
6. Phillies: .131
7. Cardinals: .127
8. Reds: .116
League: .140
The Dodgers weren’t simply a collection of sluggers though. They were a well-rounded offensive juaggernaut. Consider Gross Productive Average (GPA): (1.8 * .OBP + .SLG) / 4 = .GPA. Invented by The Hardball Times Aaron Gleeman, GPA measures a players production by weighing his ability to get on base and hit with power. This is my preferred all-around stat.
GPA: 1950 National League
1. Dodgers: .267
2. Braves: .254
3. Pirates: .252
4. Giants: .250
5. Cardinals: .248
6. Phillies: .248
7. Reds: .240
8. Cubs: .240
League: .250
The Phillies were below
 the league averages for runs scored per game (4.60 to 4.66), On-Base-Percentage (OBP) (.331 to .333), Slugging Percentage (.396 to .401), walks (535 to 567), and Home Runs (125 to 138). The Phillies were seventh in stolen bases with less than half as many as the Dodgers (77 to 33). The Dodgers hit 22 more doubles, 69 more home runs and drew 72 more walks than the Phillies. While the gap between hits was small (1461 for the Dodgers, 1440 for the Phils) and the Phils had more triples (55 vs. 46), the Dodgers were really much better at the plate. The Phillies had to scrap and fight for every run.
The Phillies did it with pitching and defense. They were an atypical 1950s baseball team because they relied on pitching and defense to compensate for a generally light-hitting offensive unit. The popular image of 1950s baseball teams as being reliant on offense, and specifically the home run, is embodied by the Dodgers and Hall of Famers like Jackie Robinson, Roy Campanella and Duke Snider. The Dodgers were a fearsome offensive force but struggled defensively. The Dodgers allowed 736 runs to the Phillies 624, a 112 run difference:
Runs Allowed:
1. Phillies: 624
2. New York: 643
3. St. Louis: 670
4. Brooklyn: 724
5. Cincinnati: 734
6. Boston: 736
7. Chicago: 772
8. Pittsburgh: 857
A big factor here was that the Phillies pitching was substantially better than the Dodgers pitching. Few would dispute the fact that the Phillies had the best pitching staff in the National League that year:
ERA
1. Phillies: 3.50
2. Giants: 3.71
3. Cardinals: 3.97
4. Braves: 4.14
5. Dodgers: 4.28
6. Cubs: 4.28
7. Reds: 4.32
8. Pirates: 4.96
League: 4.14
ERA – Earned Run Average: (Earned Runs * 9) / IP = ERA
However, ERA only tells part of the story. As baseball pundits have shown, ERA is oftentimes influenced by the defensive play of the fielders behind the pitcher. Consider Fielding Independent Pitching: FIP is simply where we eliminate defense and concentrate on how a team’s pitchers did with things they could control: strikeouts, walks, home runs. The formula is simple: (((13 * HR) + (3 * BB) – (2 * K)) / IP) + League Factor. If we strip out and neutralize defense, the Phillies still turned in a great performance:
FIP ERA:
1. Phillies: 3.89
2. Cardinals: 3.95
3. Braves: 4.04
4. Giants: 4.14
5. Reds: 4.17
6. Dodgers: 4.20
7. Cubs: 4.23
8. Pirates: 4.50
League: 4.14
Even with the tremendous fielding the Phillies got in 1950, they still pitched stunningly well. Notice that the Giants pitching falls off dramatically when you strip out defense from the equation
 .
.How can we tell how well the Phillies fielded in 1950? By looking at their Defense Efficiency Ratio (DER). Simply put, DER measures how well the Phillies did with the balls that were put into play by their pitchers. DER – Defense Efficiency Ratio: (Batters Faced – (Hits + Walks + Hit By Pitch + Strikeouts)) / (Batters Faced – (Home Runs, Walks + Hit By Pitch + Strikeouts)) How often fielders convert balls put into play into outs. Here how the Phillies did in terms of DER:
Defense Efficiency Ratio (DER):
1. New York: .729
2. Phillies: .719
3. Reds: .708
4. Dodgers: .703
5. Cardinals: .702
6. Pirates: .701
7. Dodgers: .701
8. Cubs: .694
The good defensive play and the good pitching allowed the Phillies to win the close games and edge the Dodgers for the pennant. The Phillies were 30-16 (.652) in one-run games, whereas the Dodgers were just 23-21 (.523). The 1950 Dodgers played in more “blow-out” games (games decided by five or more runs) than the Phillies: 46 to 28, so a lot of the runs they scored were “wasted”, scattered throughout the season where they would have benefited the Dodgers had they been scored in more games. Pitching and defense won out, despite the fact that the Dodgers run differential was far better than the Phillies:
Phillies: +98
Dodgers: +123
The Phillies had the best record in the NL in games decided by a run:
Win-Loss (Pct.)
1. Phillies: 30-16, .652
2. Giants: 26-17, .605
3. Dodgers: 23-21, .523
4. Cubs: 21-22, .488
5. Pirates: 21-22, .488
6. Braves: 18-21, .462
7. Cardinals: 23-29, .442
8. Reds: 16-30, .348
If you look at the Pythagorean Win-Loss records, the National League should have been won by the Dodgers:
1. Dodgers: 88-66
2. Phillies: 87-67
3. Giants: 86-68
4. Braves: 82-72
5. Cardinals: 79-74
6. Reds: 68-85
7. Cubs: 64-89
8. Pirates: 61-92
 The Phillies out-performed their Pythagorean Win-Loss record by four games. Not a major variance, but a significant one. Aside from the Pirates under-performing their Pythagorean record by four games, no other team had a plus or minus number greater than two. So that edge in close games was the decisive factor in the Phillies 1950 pennant. That pitching and defense was the factor that gave the Phillies the pennant over a team that was probably a little better than they were.
So who were the Phillies top performers? Let’s start with the Phillies position players …
Gross Productive Average (GPA):
Andy Seminick (C): .311
Del Ennis (RF): .305
Dick Sisler (LF): .278
Richie Ashburn (CF): .268
Willie Jones (3B): .266
Eddie Waitkus (1B): .243
Granny Hamner (SS): .236
Mike Goliat (2B): .233
Dick Whitman (OF*): .218
Stan Lopata: (C*): .216
Jimmy Bloodworth (IF*): .186
Team: .248
League: .250
* indicates these players are reserves.
The Phillies offense fell below the league average for GPA. They simply did not preserve their
 outs and move runners as effectively as teams like the Dodgers or Braves did. The Phillies scrapped for runs and largely relied on Del Ennis. Seminick played well, but as the team’s catcher he had to miss about a fifth of the team’s games because catching wears even the toughest ballplayers out. Sisler, Ashburn and Jones all moved runners well, but Ennis was the key to the Phillies offense. Aside from Seminick, he had the highest GPA on the team. He was also the team’s most powerful bat:
Isolated Power (ISO):
Del Ennis (RF): .240
Andy Seminick (C): .236
Willie Jones (3B): .189
Dick Sisler (LF): .146
Mike Goliat (2B): .132
Granny Hamner (SS): .110
Richie Ashburn (CF): .099
Eddie Waitkus (1B): .075
Stan Lopata: (C*): .070
Dick Whitman (OF*): .053
Jimmy Bloodworth (IF*): .021
Team: .131
League: .140
Again, Seminick’s contributions are tempered by the fact that he missed about 20% of the team’s games. Ennis is clearly the Phillies big threat to move the runners along. Subtract Ennis from the Phillies lineup and their slugging percentage falls to just .377, just .001 better than the Cincinnati Reds, the team with the lowest slugging percentage in the game.
Ashburn’s .099 ISO isn’t much of a surprise: he was the quintessential lead-off man, so hitting for power was the furthest thing from his mind. In fact, his 1950 ISO was pretty good: his career ISO was .074. Ashburn hit a career-high fourteen triples and had fourty-one extra base hits …
Ennis was the key to the Phillies offense. He had 73 extra-base hits (14 more than Willie Jones), 126 RBIs (38 more than Jones) and led the team in home runs with 31 (six more than Jones). Look at Runs Created and Runs Created per 27 Outs to see how vital Ennis was to the Phillies:
Runs Created / RC27
Ennis: 114 / 7.09
Jones: 94 / 5.37
Ashburn: 91 / 5.66
Sisler: 88 / 6.17
Seminick: 84 / 7.80
Waitkus: 79 / 4.48
Hamner: 74 / 4.14
Goliat: 53 / 3.66
Whitman: 12 / 3.32
Lopata: 12 / 3.17
Bloodworth: 6 / 2.30
Team: 714 / 4.60
League: 5746 / 4.71
The Phillies had three regulars who fell below the team and league averages for runs created: Waitkus, Hamner and Goliat, essentially the team’s entire infield, aside from third baseman Willie Jones. What is surprising to me is how little production the Phillies got from their first baseman: Waitkus. First is usually a position teams stick defensively challenged sluggers in, but Waitkus had the lowest Isolated Power number of any Phillie regular and contributed less to the Phillies offense than any player save the Phillies middle infielders, Granny Hamner and Mike Goliat. I should note that Waitkus has an extraordinary contact hitter, striking out just 29 times in 1950 despite having 641 At-Bats. I marveled in a previous post at how Jackie Robinson managed to strikeout just 24 times in 518 At-Bats, but I’d be remiss if I didn’t note how Waitkus was actually more difficult to strikeout: 4.5% to 4.6%.
Ennis was clearly the Phillies offensive engine, producing 16% of the Phillies total Runs Created. Had Ennis been replaced by an average player* the Phillies would have lost 38 runs from their lineup. I think that losing those thirty-eight runs would have cost the Phillies four to eight games. Given that the Phils won thirty games by a run, that might be a conservative estimate. Since the Phillies won the NL by just two games, I think we can safely say that the Phillies would not have won the NL without Del Ennis’ contributions in 1950. They probably would have fallen to third, behind the New York Giants.
* I calculated that an average player gaining 4.71 runs created per 27 outs who made 436 outs, as Del Ennis did in 1950, would have 76 Runs Created. I suspect my methodology is seriously flawed, but there you go.
What is very interesting to me when you look at the Phillies lineup is to see how ridiculously young the Phillies players were in 1950. The Phillies regulars were 26.5 years old on average. Del Ennis was just 25. Willie Jones was 24. Richie Ashburn and Granny Hamner were 23. I’ll talk about the Phillies pitching in a moment, but consider the fact that Robin Roberts was 23 and Curt Simmons was just 21. The key players on the Phillies were absurdly young. Contrast that with the Dodgers: Campanella was 28, Gil Hodges was 26, Jackie Robinson was 31, as was Pee Wee Reese. Duke Snider and Don Newcombe were the Dodgers sole youngsters at 23 and 24 respectively. All of the ’50 Dodgers played on the ’49 World Series team, so the pressure of playing for the NL pennant was nothing new even to Snider and Newcombe. For the Phillies, the stress of chasing the pennant was entirely new. That this team of rookies and newbies held together and managed to win the 1950 National League pennant is nothing short of miraculous. They truly were the Wiz Kids.
Defensively, the Phillies were pretty darn good in 1950. The key play of the year was Ashburn’s on-target throw to Lopata to gun down Cal Abrams at the plate on the final day of the season. (See, Part XII.)
It is difficult to look at a lot of the data that we have from 1950 and get a better sense of which Phillies players played better than others because stats like Zone Rating and Plus / Minus are essentially impossible to apply retroactively. We can look at the Phillies team defense and compare the team stats to the rest of the league. As I showed, supra, the Phillies were second Defense Efficiency Ratio (DER). Consider Un-Earned Run Average (UERA):
UERA:
1. Dodgers: 0.41
2. Cardinals: 0.48
3. Phillies: 0.49
4. Giants: 0.50
5. Reds: 0.55
6. Braves: 0.64
7. Pirates: 0.68
8. Cubs: 0.79
League: 0.57
This is an imperfect stat, but clearly the Phillies weren’t allowing preventable runs the way the Cubs were.
I suspect that one of the keys to the Phillies success was their tremendous outfield. Richie Ashburn led the NL in putouts in 1950 with 405, eleven more than the Giants Bobby Thomson and 27 more than the Dodgers Duke Snider. Without knowing how often Phillies pitchers allowed flyballs versus groundballs, I figured out how often Phillies outfielders made putouts and multiplied them per 1,000 innings. Here are the results:
1. Pirates: 783.63
2. Giants: 778.91
3. Phillies: 768.85
4. Braves: 766.06
5. Dodgers: 742.26
6. Reds: 741.34
7. Cardinals: 729.35
8. Cubs: 711.89
League: 752.88
I caution that this isn’t scientific at all: the Dodgers outfielders didn’t make a lot of plays in part because their pitchers led the league in strikeouts and didn’t allow many balls to be put into play! I think this gives you an idea though. The Phillies pitchers were excellent, but they did oftentimes have to rely on their fielders to convert balls put into play into outs.
If there is anyone out there with any ideas on how we can make a more scientific analysis of the Phillies defense based on existing stats, let me know.
Speaking of the Phillies pitchers, they were quite excellent. Most people who remember the Wiz Kids remember Robin Roberts and remember how great he was in his career, but Curt Simmons was just as good. Consider the Fielding Independent Pitching ERAs of the Phillies main pitchers:
FIP:
Curt Simmons: 3.53
Robin Roberts: 3.55
Bob Miller: 3.66
Jim Konstanty: 3.70
Bubba Church: 4.09
Ken Heintzelman: 4.22
Russ Meyer: 4.56
Team: 3.89
League: 4.14
Simmons was, in some respects, a better pitcher than Roberts that season. He was tougher to get a home run off (0.79 home runs per nine innings versus 0.86 for Roberts) and struckout more batters (6.12 strikeouts per nine innings versus 4.32 for Roberts). Roberts was tougher to get a walk off (2.28 walks per nine innings compared to Simmons pedestrian 3.69), and there is an argument that Roberts probably suffered from fatigue. Simmons left for the Army in mid-season while Roberts stayed with the team and carried the load for the pitching staff. Roberts started 39 games to Simmons 27, completed 21 compared to Simmons 11, threw five shutouts to Simmons two, and faced 1,228 batters in 1950, second in the National League that season to the Braves Vern Bickford (who faced an astonishing 1,325 batters) to Simmons 896. Robin Roberts was the Phillies best pitcher and the ball for the October 1 game against the Dodgers belonged in his hand, but Roberts and Simmons made for a lethal one-two punch.
The rest of the Phillies pitching staff was also extremely good. Bob Miller, I was stunned to see, was an absurdly difficult pitcher to hit a home run off of: 0.47 per nine innings (nine home runs allowed despite facing 755 batters). Roberts surrendered 29 home runs in 1950, but he also faced 1,228 batters along the way. Despite having to play the Dodgers, Braves and Cubs, the Phillies pitchers were stingy with the home runs allowed: 0.78 per nine innings, best in the league, compared with the league average of 0.90 …
After Roberts and Simmons, the Phillies most important pitcher was Jim Konstanty. On a team nick-named the Wiz Kids for their youth, Konstanty was 33 that season and was an unlikely hero. In an age before specialized closers dominated the ends of baseball games, Konstanty was the Phillies closer, their fireman. Konstanty appeared in 74 of the Phillies 157 games (47%), making twenty-three more appearance then the Pirates Murry Dickson. Konstanty saved twenty-two games, fourteen more than the Pirates Bill Werle. Konstanty finished sixty-two of the Phillies games, thirty-nine more than the Pirates Vic Lombardi. Konstanty was the winning pitcher or the saving pitcher in thirty-eight of the Phillies ninty-one victories. Even though Konstanty’s FIP ERA was a run higher than his “real” ERA (3.70 vs. 2.66), he was a terrific pitcher whose ability to keep runners off the base paths was absolutely critical to the Phillies success. Despite being a below-average strikeout pitcher (just 3.32 per nine innings, compared to the team average of 3.96 and the league average of 4.09), he kept runners off the base paths. Konstanty’s WHIP was just 1.04, lower than Roberts (1.18) or Simmons (1.24).
And that was how the NL was won. Through tough defense, imposing pitching and timely hitting. Looking at all of the Phillies, you have to say that they had many players whose performance can be categorized as “critical”, from Del Ennis’ hitting to Roberts, Simmons and Konstanty’s pitching to Richie Ashburn’s fielding. Without those five players, the Phillies would have been dead in the water in 1950 and simply been an also-ran, a footnote, in the story of the Dodgers and Giants duopoly of the NL during the 1950s.
Instead, the Wiz Kids were on to the World Series.
Previous Installments of the Wiz Kids:
Part XII: October 1, 1950.
Part XI: Richie Ashburn.
Part X: The Phillies Farm System.
Part IX: The second half of the 1950 season.
Part VIII: The Braves, Cardinals, Pirates, Cubs & Reds.
Part VII: The Giants and Dodgers.
Part VI: Curt Simmons.
Part V: Robin Roberts.
Part IV: The first half of the 1950 season.
Part III: Jim Konstanty.
Part II: Eddie Sawyer.
Part I: The Path to 1950.
Prolouge.
Comments:
Post a Comment

![]()


